
Closing At Resistance: September 4 Stock Market Preview
In tonight’s YouTube video (which can be viewed by clicking here), we take a look at a different perspective on SPX as well as several different individual tickers like GLD, so check it out if you have a few minutes.
Yesterday, we focused on the weekly chart for the VIX, noting the weekly 9-period SMA at 16.22 as a line in the sand. Today, let’s look at the daily chart for additional levels to watch on the VIX and what appears to be happening.
The VIX crush following the spike toward 20 continued today, with the VIX closing at the low of the day.
Volume today was highest at the 20 strike, and we see the VIX is above the Hull Moving Average and the 9-period SMA, two indicators maintaining a buy signal for the VIX.
While the weekly 9-SMA has dropped to 16.09, the daily 9-SMA is at 15.40, and the Hull is at 15.68, giving us an area between 15.40-16 to watch for a possible volatility reversal back up. I would expect any further upside in indices to show signs of topping as the VIX reaches those lower levels, if those levels are going to hold.

We see indices (SPX and QQQ in particular) closing right at key resistance, testing the 9-SMA from below on the daily chart. Note that SPX is holding above the weekly 9-SMA, for now (weekly chart not shown tonight).
The 6448 close is a mere 1 point from the 9-SMA, and 17 points from the Hull, so we are close enough to see this line conquered in the short term with another trip to 6500.
SPX net GEX increased back into positive territory today.
I still view the breaking of the uptrend line to be important, and the fast VIX cruses back toward 15-16 don’t leave much room for volatility sellers to press that lever in favor of indices rallying further, unless we’re on the cusp of a VIX regime shift to lower levels (recent history would say this has lower odds than holding at 15 or higher).

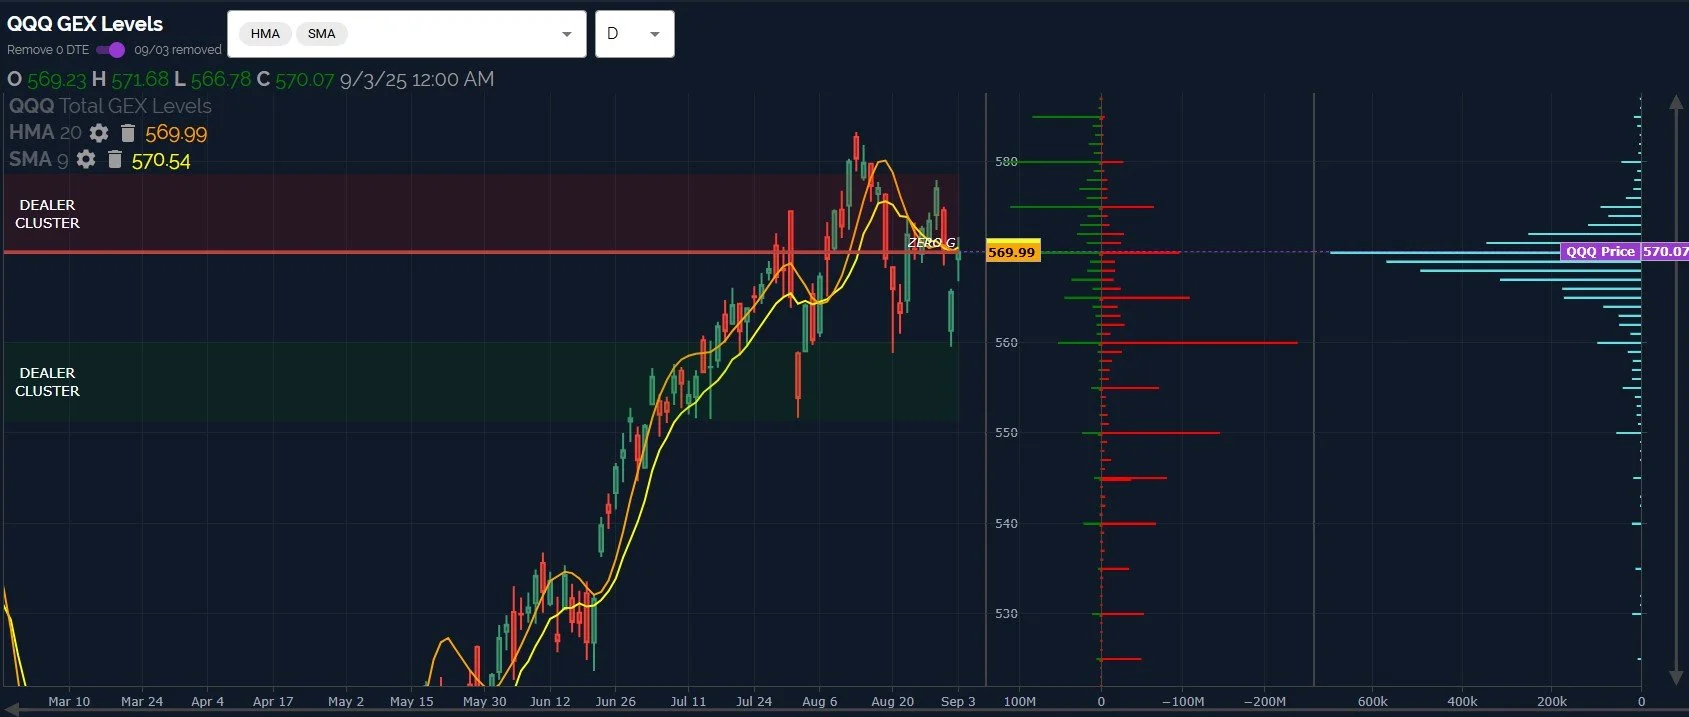
QQQ barely closed above the daily Hull yet still closed .47 away from the 9-SMA. Getting this close to the line introduces the possibility of more pain for bears, similar to SPX. A gap up above the line becomes a real possibility with such an obvious close at resistance.
580-583 represents an upside target range based on both GEX as well as confluence with the weekly Hull.
As mentioned for SPX- my plan (in the event of a continued rebound) will be to evaluate the complete picture when the first of two things happen: Either the VIX reaches 15.4-16.09 or the indices reach the upper Dealer Cluster zones at the GEX clusters mentioned, 6500 and 580.
If GEX has shifted intraday as those targets are reached, we’ll obviously give consideration to such a shift in data.
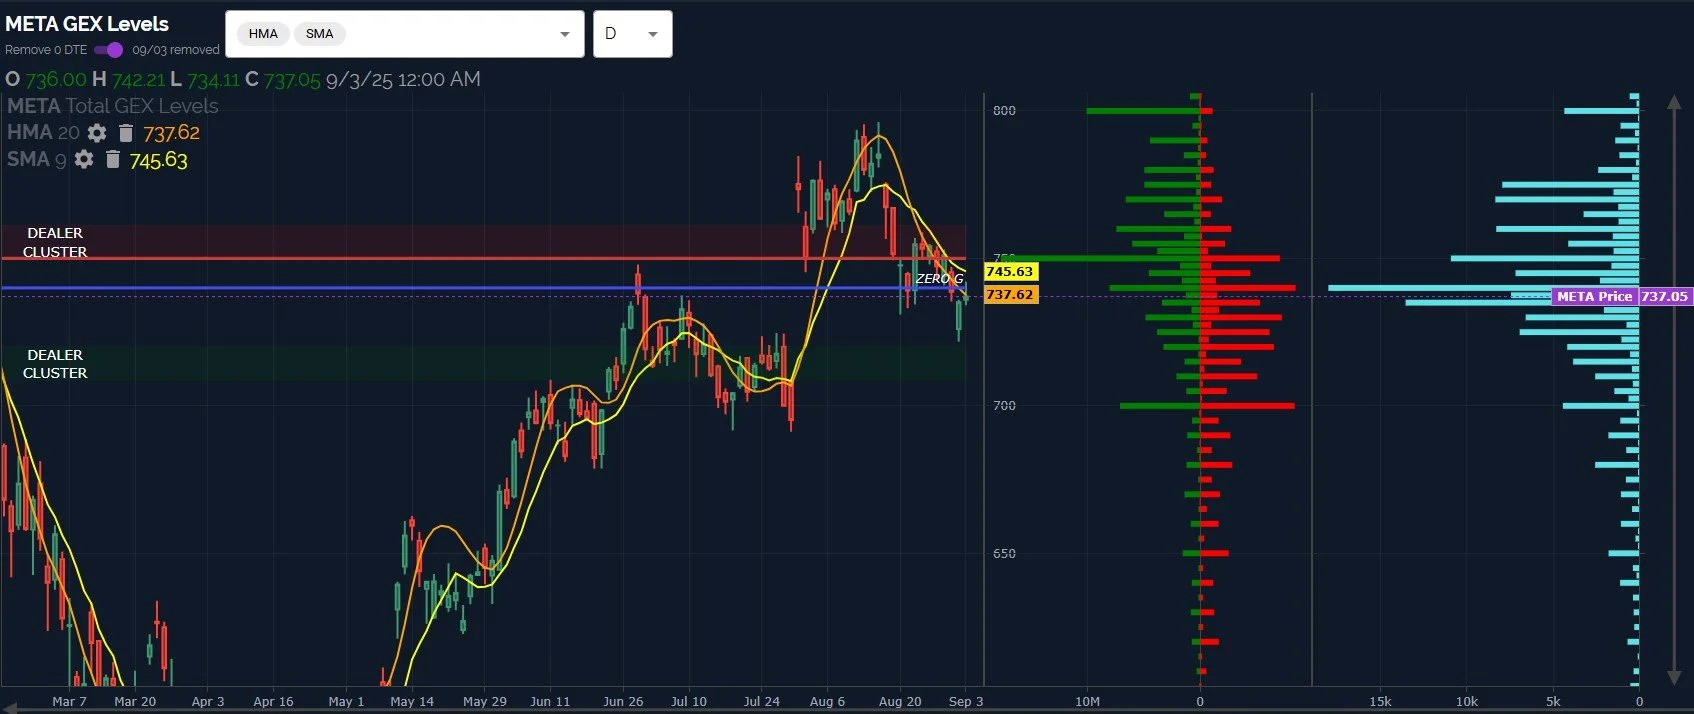
AAPL and GOOGL performed the heavy lifting for QQQ today on the heels of the antitrust news, but both appear to be near extreme upside targets as of today’s close. If indices continue higher, META may be a ticker that has a setup conducive toward rallying.
We see early signs of the 9-SMA curling, a gap filled, and GEX+option volume mostly at higher strikes.
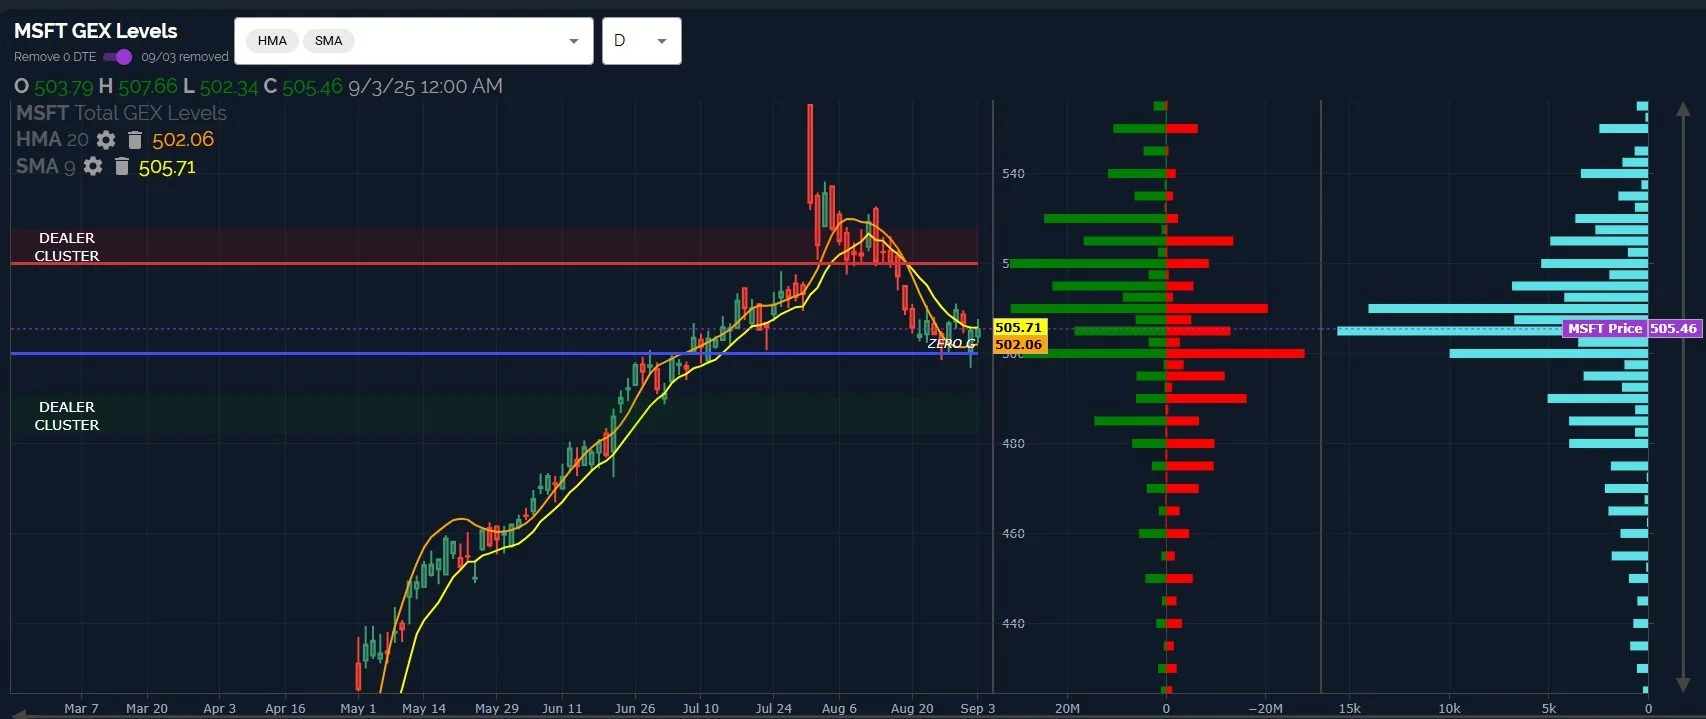
Lastly, MSFT may be another name to consider, with the Hull+9 SMA already turning up, and 520 giving us a large GEX cluster to watch overhead.
With the VIX already close to 16, wider ranges intraday this week may lend toward yet another short-term trend change/reversal coming soon, so stay on your toes and join us in Discord where we’ll be posting what we see on the 0 DTE picture.
Here’s the link to our Discord server if you haven’t joined us yet! Discord is our most active social media setting. Access is free for some channels, and new members have a 7-day trial within Discord to see how we operate. We have an active community of thoughtful and experienced traders who chime in throughout the day, and several channels dedicated to intraday and weekly trading.
You can join our discussion every day when we discuss markets in real-time via our Geeks Live livestream, currently available to all subscribing members!
If you’re interested in accessing our tools and analytics, be sure to check out our website! We have a lot of additional improvements in the works!
If you’re interested in learning more about our strategy and approach, we address all of these topics in our Geek University course which is included in all memberships.
We posted a YouTube video today, as mentioned at the beginning of the newsletter, and we have useful and educational playlists, so give our channel a look if you’re curious about recent market commentary and ideas as well as gamma (GEX) concepts explained.
Thanks for being part of our community and know that we invite your feedback!
The information provided by Geeks of Finance LLC is for educational purposes only and is not intended to be, nor should be construed as, an offer, recommendation or solicitation to buy or sell any security or instrument or to participate in any transaction or activity. Please view our Investment Adviser Disclaimer and Risk Disclosure.