
Patience Amidst A Parabola
SUMMER PORTFOLIO MANAGER ANNUAL SUBSCRIPTION PROMO- We’re currently offering $300 off of the annual Portfolio Manager subscription, which includes access to our full GEX dashboard, a 5-hour Geek University course, full Discord access including trade ideas, and our daily livestream. Take advantage now, deal with the summer heat on your own, but let our tools remove some heat from your portfolio! Enter code SUMMER2025 at checkout to lock in a great annualized cost for access to our highest level subscription!
We posted a YouTube video today, which you can watch by clicking here. We take a look at this interesting inflection point for markets as well as some individual tickers, so check it out!
We clearly see a strong move higher for the indices with virtually no pullbacks, and many also know that such a move is unsustainable and likely to reverse at some point. I’m reminded of Sir Isaac Newton and his experience in the South Sea Company, the focal point for the Dutch tulip bulb bubble (we really need historical context from our favorite Dutch trader, Tony). Newton is famously credited with saying “I can calculate the motions of the heavenly bodies, but not the madness of the people.” A brilliant man who lost a fortune buying and selling stock during the topping period for the South Sea Company. The Smithsonian has an entertaining article that you can visit for more information on the tulip mania here. I think a helpful lesson from history is that we can still tilt the odds in our favor with data such as GEX positioning data, but there are no guarantees, and tops and bottoms are never easy. In this context, we’re looking for a short-term top, but certain technical confirmation points need to be fulfilled to increasingly move a reversal from theoretical to reality.
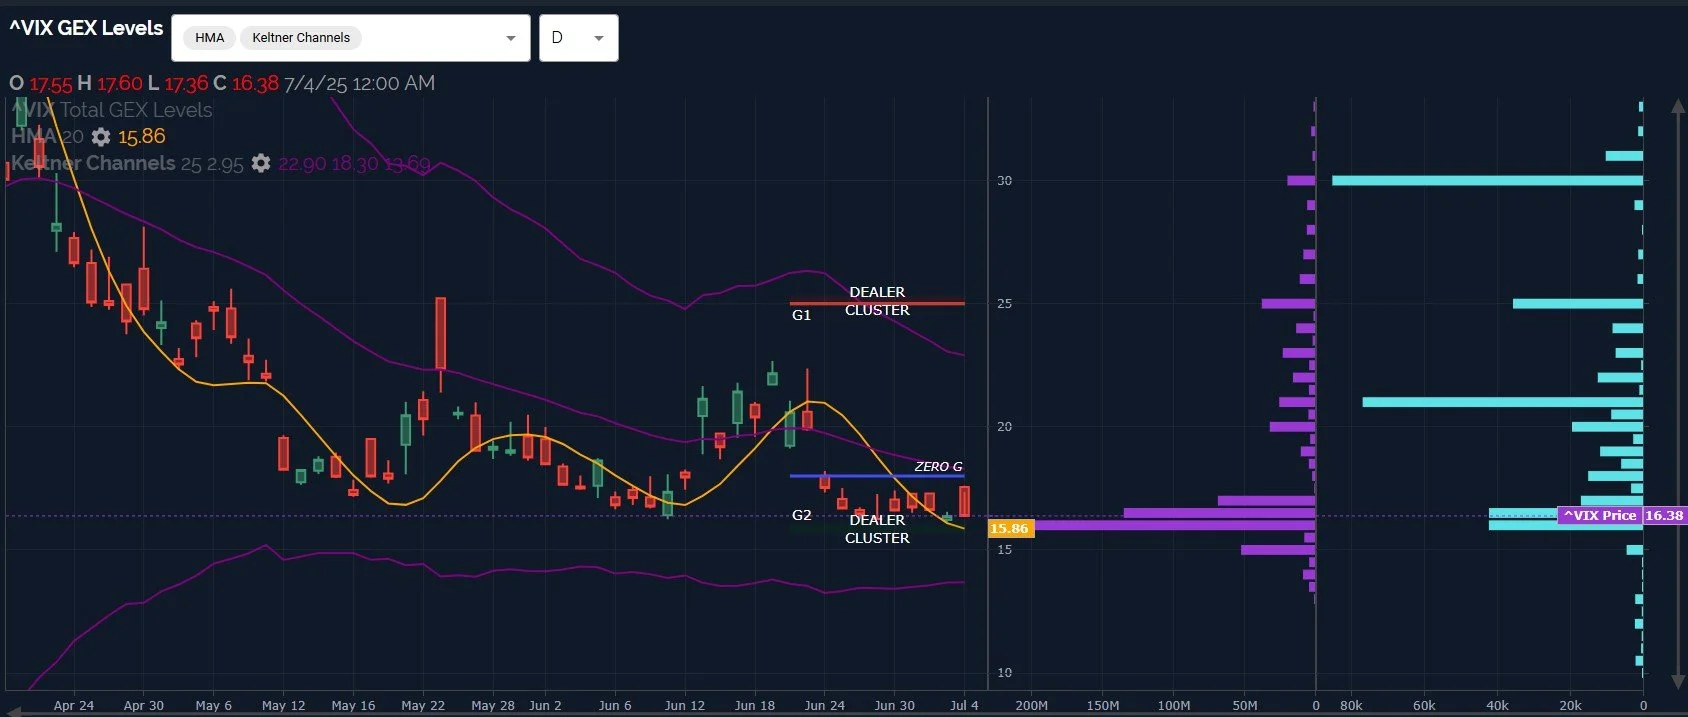
Our Thursday evening caution (as denoted in the Thursday newsletter headline- “VIX Divergences Building”) regarding the VIX seems to have encountered an initial spark that might not be noticed by many, with the VIX spiking up to 17.60 while cash markets were closed on Friday. This spike occurred right after we saw the first close above the Hull Moving Average (the yellow line) in almost 2 weeks. Note the highest volume at the 30 strike and 22 coming in at a close 2nd, so participants have been more interested in strikes above VIX 16 than below VIX 16. GEX backs this up, with very little GEX visible below 16 and non-existent below 14. As long as we see the VIX above the Hull, my bias is that declines in volatility to the Hull will be bought and thus reverse, consistent with the GEX picture given the Hull beginning to flatten at 15.86.
We’ll take a closer look at IWM and SPX in a second, but starting with a brief look at DIA, we see two obvious moves higher since April, with a mostly sideways consolidation in between. Price is extended above the upper Keltner channel, which is not very common, and especially not in a sustained fashion, with the yellow Hull Moving Average pointing almost straight up. We can see 2-3 examples just on the short timeframe visible, but when the Hull is pointing higher this sharply at the upper Keltner channel, that’s typically close to where we see markets reverse as price eventually crosses back under the Hull. The upper Dealer Cluster zone where we expect dealers to potentially become sellers resides at 450, just over head, and we saw high volume at lower strikes ranging from 392 to 420. Interestingly, DIA GEX topped June 30 and GEX is now below June 24 levels, meaning the same level as the day before the sharp rally took place that has led to this point.

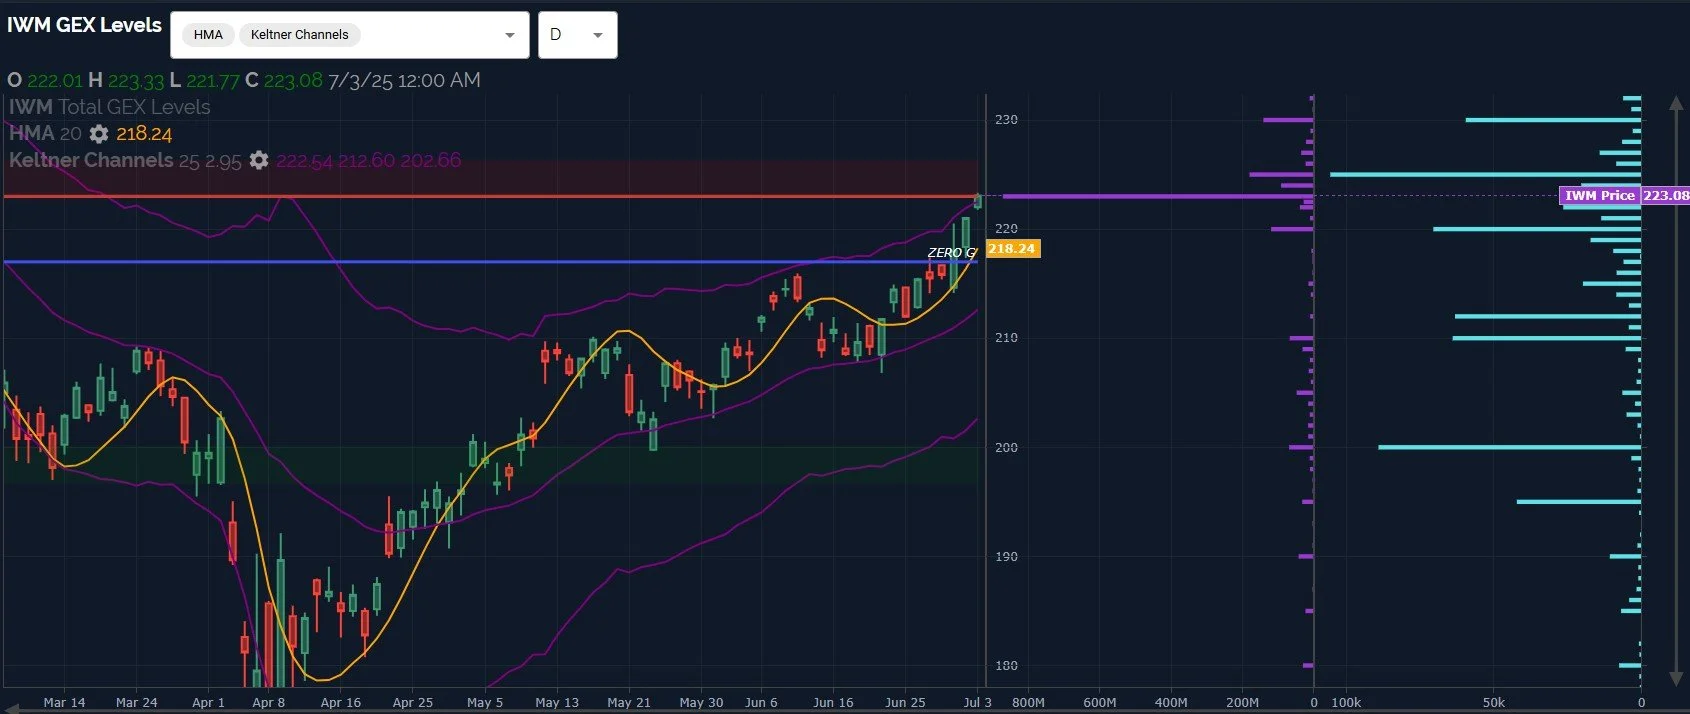
IWM has exceeded the upper Keltner channel, though not quite as extreme as we see with DIA, but we still see similar attributes in some respects: a sharply rising Hull, distance between the Hull at 218.24 and Thursday’s closing price at 223.08, and high volume at lower strikes (200 and 210/212 catch my attention). Particular to IWM is a sharp reversal in negative GEX to positive after the bulk of the recent move has already occurred.
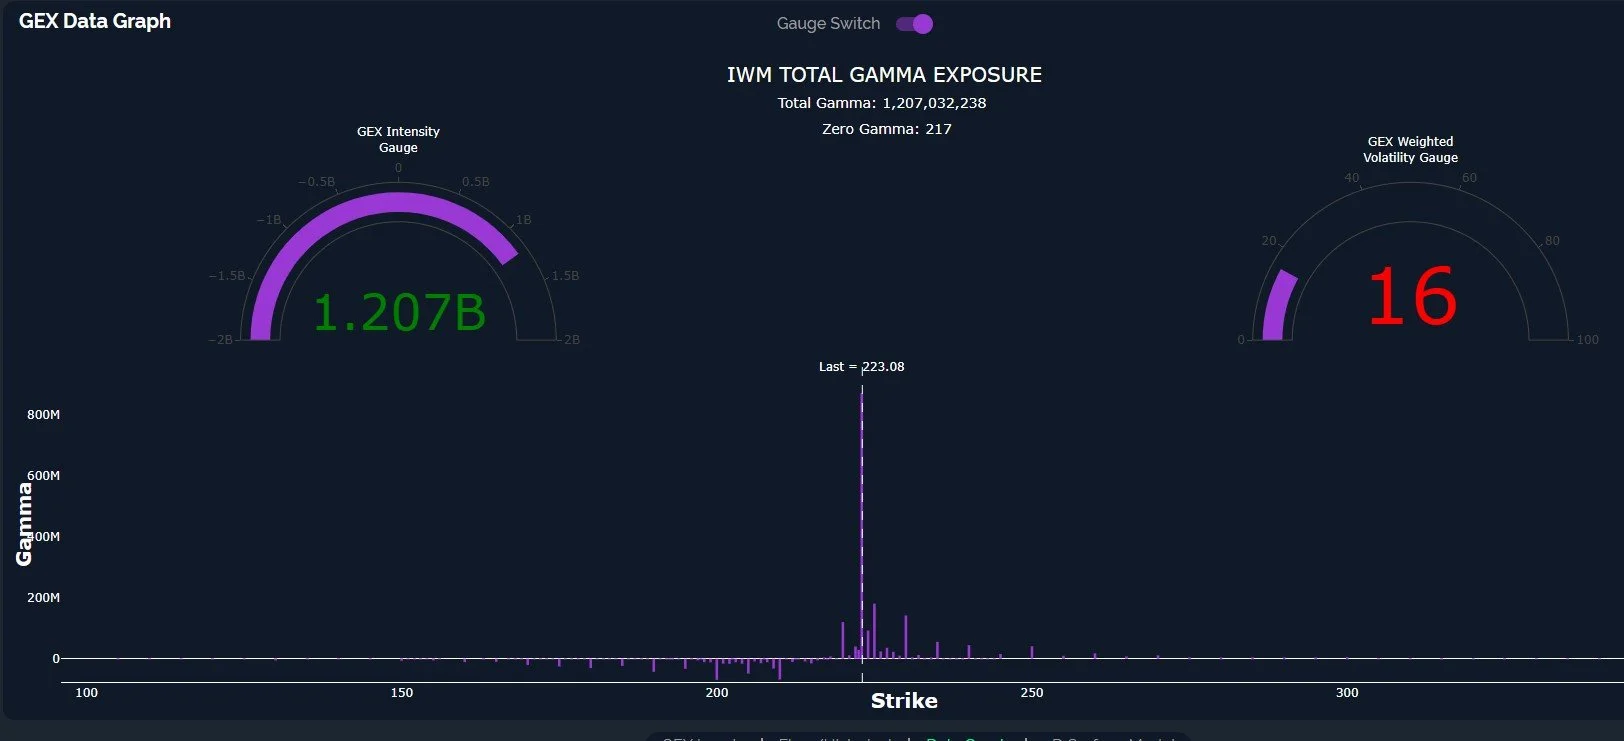
Taking a closer look at IWM GEX, the current reading of 1.2B net positive GEX is higher than most comparative dates looking back over the last 52 weeks, and I’ll also note that IWM was stubbornly mired in deep negative GEX until the recent breakout, meaning IWM GEX might be better viewed as a contrarian capitulation signal while indices like SPX seem to be more forward looking with positive correlation, except in the most extreme circumstances (of course we’re about to present an extreme circumstance with SPX, and I recognize the irony).
Here’s SPX, with Thursday’s gap up creating a lot of space, also stretching quite far above the upper Keltner channel. The Hull is now matching with the Keltner channel, and SPX’s price is in rare territory as we reach new highs while also having climbed some 250+ points without a pullback. We’re getting to the point where suggesting a retest of 6000 (which we saw some 9 trading days prior) will elicit visceral reactions, making it all the more likely, in my view. Admittedly not a scientific view, but hopefully we all see that retail emotions run highest at pivotal turns.
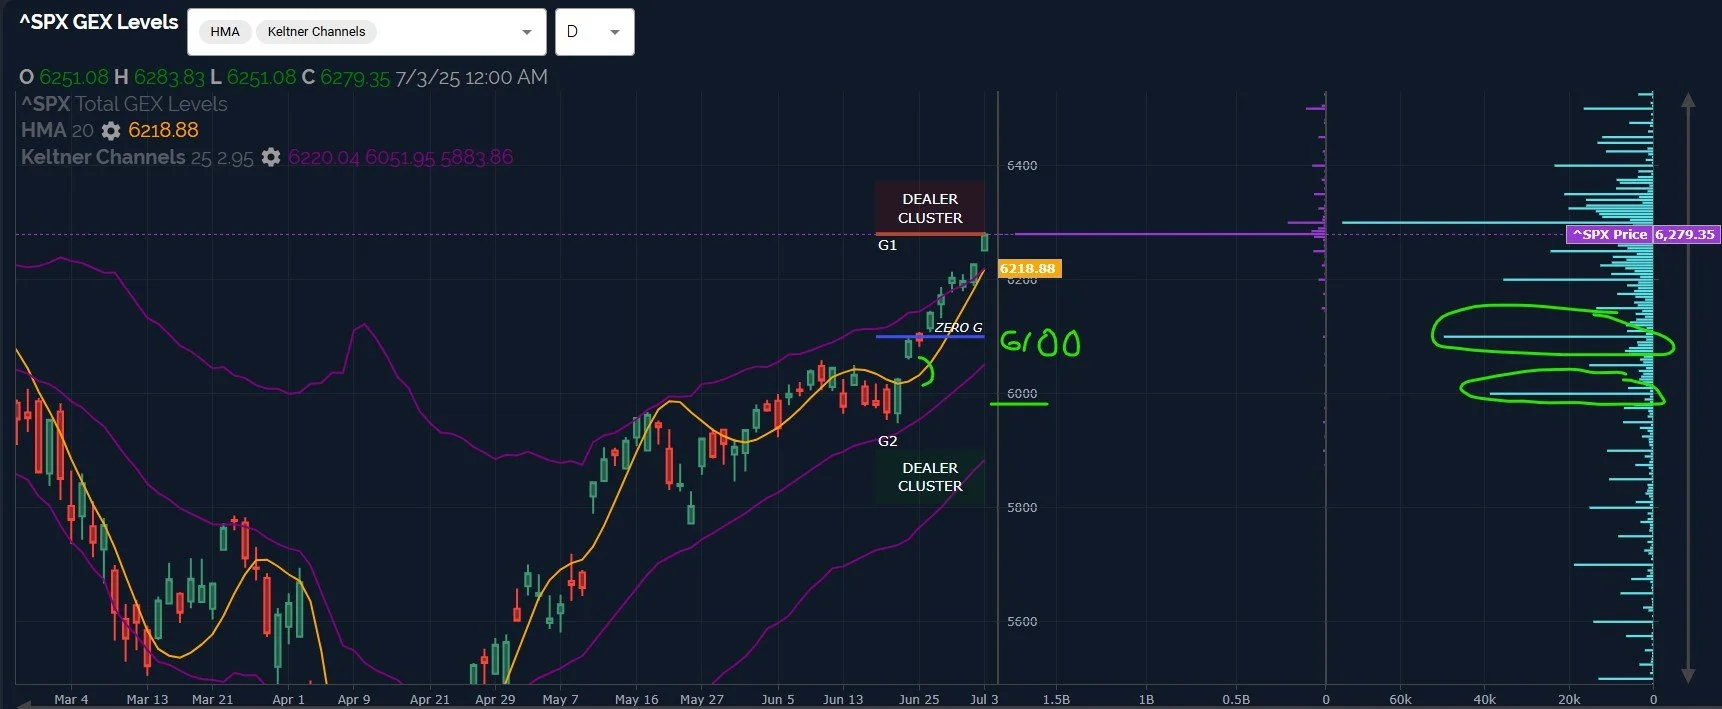
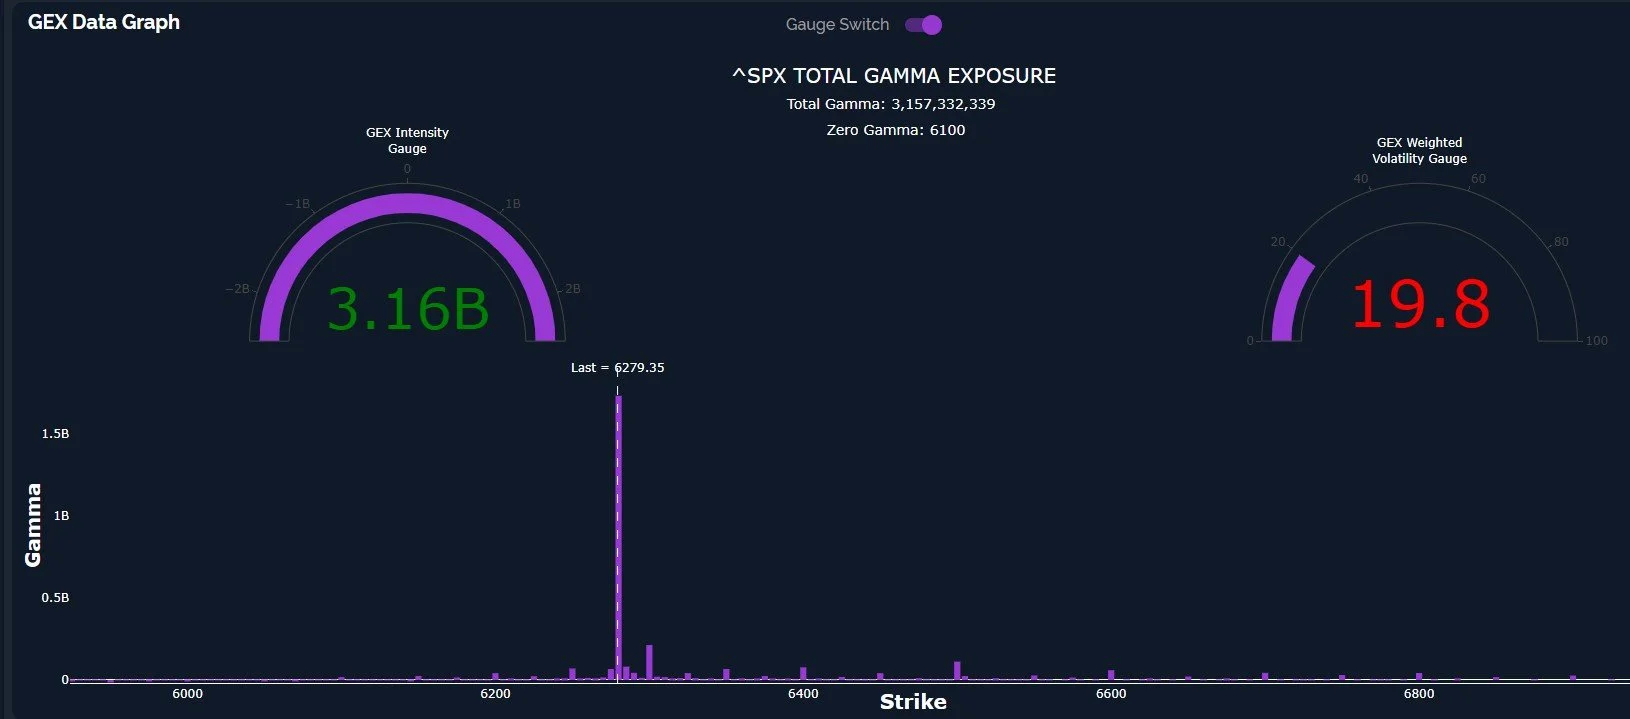
SPX finally reached a net GEX level that is at an extreme relative to the past 52 weeks, and such an achievement has been a good indicator for reversals in the past. In conclusion, everything points toward a pullback arriving soon, and we don’t know exactly where this pullback will land, though we expect more information will emerge that will assist us in our decisions as we look to buy the dip. The Keltner channels are pointing higher and GEX clusters are tilted toward higher levels consistently across all indices, so we’re confident that the upcoming drop will give us at least one more rally before the year is over. We’ll certainly update our subscribers as our views evolve in coming days/weeks.
Here’s the link to our Discord server if you haven’t joined us yet! Discord is our most active social media setting. Access is free for some channels, and new members have a 7-day trial within Discord to see how we operate. We have an active community of thoughtful and experienced traders who chime in throughout the day, sharing ideas and opportunities as we see them.
If you’re interested in accessing our tools and analytics, be sure to check out our website! Mobile updates are now live for a better mobile experience and both subscription tiers have access to our full list of tickers!
If you’re interested in learning more about our strategy and approach, we address all of these topics in our Geek University course which is included in all memberships.
We posted a YouTube video today, as mentioned at the beginning of the newsletter, and we have many other short videos, so give our channel a look if you’re curious about recent market commentary and ideas as well as gamma (GEX) concepts explained.
Thanks for being part of our community and know that we invite your feedback!
The information provided by Geeks of Finance LLC is for educational purposes only and is not intended to be, nor should be construed as, an offer, recommendation or solicitation to buy or sell any security or instrument or to participate in any transaction or activity. Please view our Investment Adviser Disclaimer and Risk Disclosure.