
Can Divergences Become Any More Extreme?
SUMMER PORTFOLIO MANAGER ANNUAL SUBSCRIPTION PROMO- We’re nearing the end of our offering $300 off of the annual Portfolio Manager subscription, which includes access to our full GEX dashboard, a 5-hour Geek University course, full Discord access including trade ideas, and our daily livestream. Enter code SUMMER2025 at checkout to lock in this deal in the last remaining days!
Today’s YouTube video can be viewed by clicking here. Check it out if you have a few minutes!
The short answer to the question in the title is yes, divergences can always grow more extreme, which is a good thing to remember when looking at levels that appear to be “extreme.”
That said, we believe a number of indicators still justify caution in coming days.
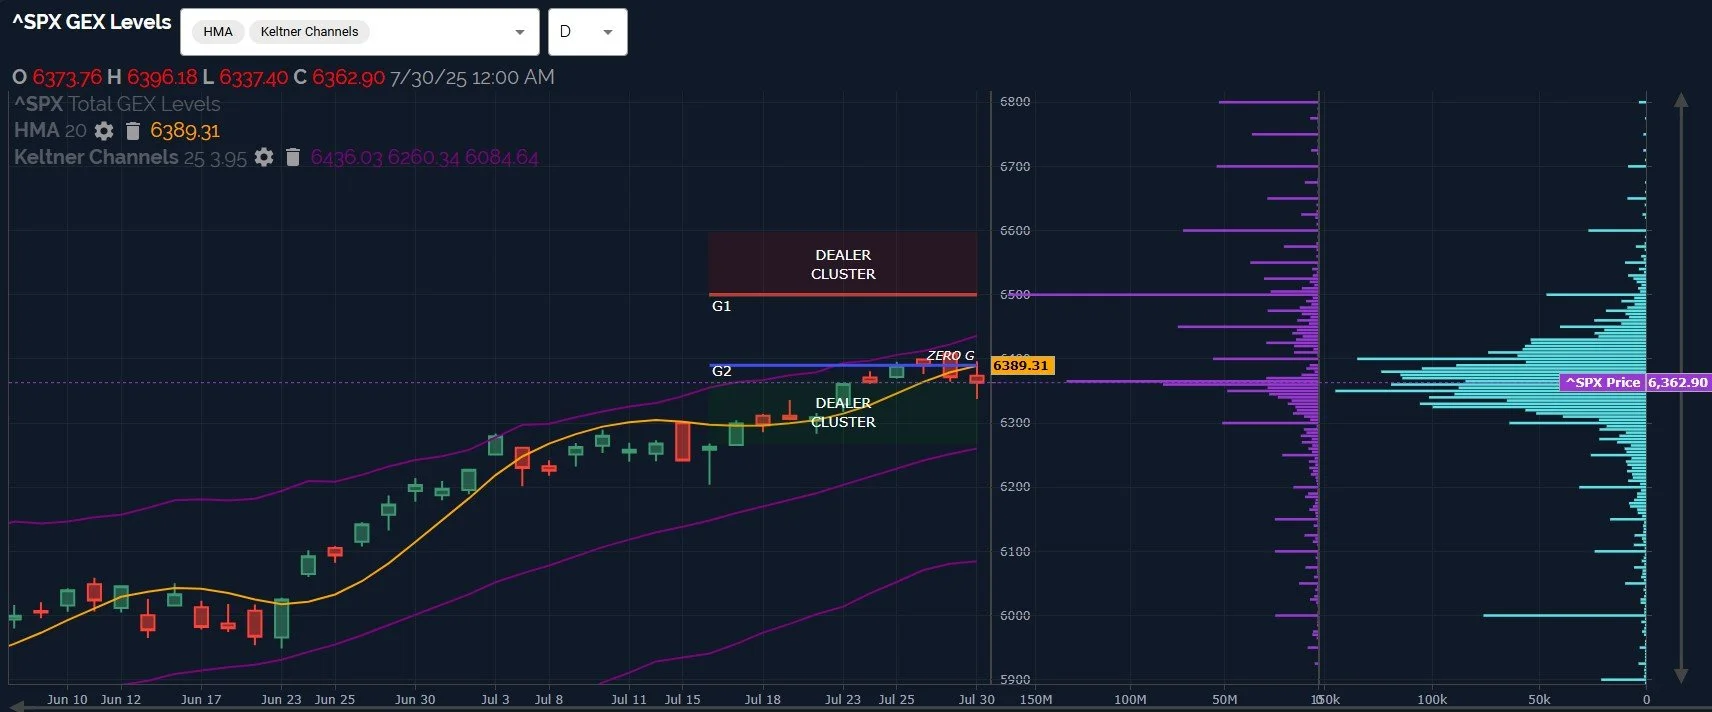
Indices closed just below the Hull Moving Average, though not convincingly so, except in the case of IWM.
We also saw a bearish divergence with SPX relative to QQQ, not entirely unexpected given the already broadcast timing of MSFT and META earnings being released after the close.
QQQ proceeded to make a new high after hours, while SPX is still short of making new highs.
6390 is now an important line-in-the-sand for a possible move toward the upper Dealer Cluster zone at 6500 or a drop further into the lower Dealer Cluster zone, if we can’t overtake 6390 on a daily close.
QQQ closed virtually right on the line of the Hull as well, and after-hours trading indicates a likely test of the 575-580 GEX clusters we’ve been mentioning in the recent past.
A lack of noticeable GEX above 580 remains, lending credit toward a view that any spike toward 580 is likely a good opportunity to hedge, short, or take profits on existing long trades that have made it into the stratosphere.
The after-hours move to almost 573 implies a little more upside toward 575-580 based on GEX and retaking the 568.43 Hull, just to hammer home the previously disclosed view.

IWM perhaps signals the greatest risk for the broader indices in its acceleration today of a negative move below the daily Hull Moving Average.
In the short run, we do see IWM testing the 220 GEX cluster after hours, where we might see support, but any rally attempt will potentially meet resistance at 224 at this point.
A point of contention and contradiction recently has been the large GEX cluster at 230, which is mostly concentrated at August 15, contrasting with competing negative GEX at 210-215 at the same expiration.
The negative GEX clusters indicate a relatively modest drop for IWM back to 210, which is bullish for a possible rally later this year, but the near-term foggy picture remains for now.

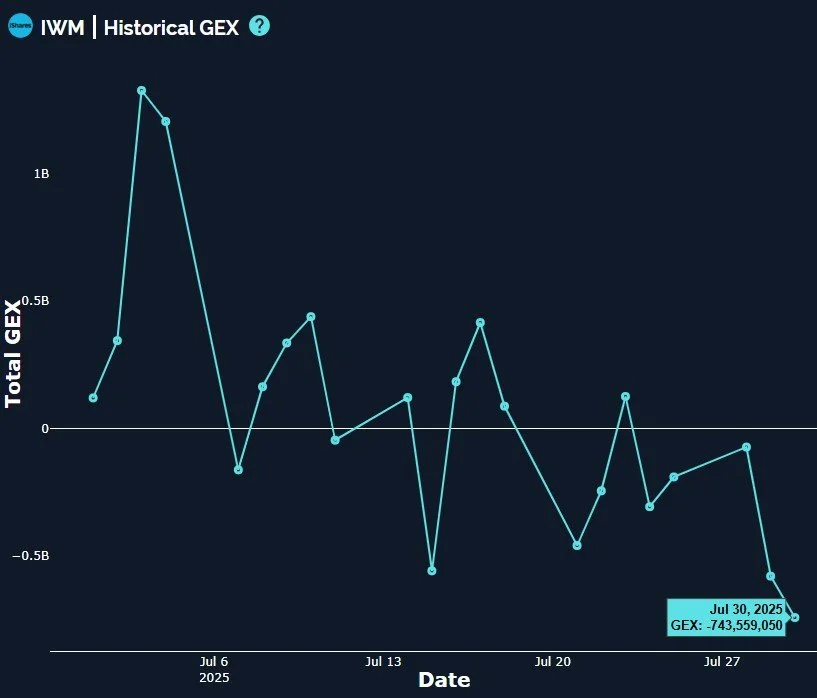
Possibly justifying the short-term bearish picture, IWM dropped further into negative net GEX territory.
IWM GEX has been a good contrarian indicator at extremes, so we need to be aware of the risk that the deeper dive into negative GEX territory may signal a short-term rebound, though the previous identification of 224 as a meaningful area of resistance should still be respected as an ultimate delineation between bullish or bearish resolution.
The environment recently has been tough for longs and shorts, as the weakness outside of the “Magnificent Seven” has been noteworthy, though the biggest tech companies continue pushing ever higher.
Our recent observation of the VIX maintaining a bullish picture on the 4-hour chart proved correct, with our 17 upside target being met and slightly exceeded today.
We said holding above 17 opens the door to 20, which didn’t happen today, but the level remains relevant.
The current view (with the VIX now below major support on the 4-hour and QQQ up a lot) is that the VIX may retest recent lows toward 14.5, though this is likely to be a very brief stop with a fairly quick reversal in store.

The VIX daily chart seems to back this view, with a lot of volume at higher strikes between 20-60, and virtually no GEX interest below the 15 strike, either.
We see multiple years of history backing the idea that the VIX below 15 may signal a huge shift in the overall VIX regime, and therefore a low probability, so we are looking for the VIX to hold and reverse higher from the 14.5-15 area until proven otherwise.
As always, we remain open-minded and we will update our views based on shifts in the intraday picture, so join us in Discord where we will share these updates with our subscribers.

Here’s the link to our Discord server if you haven’t joined us yet! Discord is our most active social media setting. Access is free for some channels, and new members have a 7-day trial within Discord to see how we operate. We have an active community of thoughtful and experienced traders who chime in throughout the day, and several channels dedicated to intraday and weekly trading.
If you’re interested in accessing our tools and analytics, be sure to check out our website! Mobile updates are now live for a better mobile experience and both subscription tiers have access to our full list of tickers!
If you’re interested in learning more about our strategy and approach, we address all of these topics in our Geek University course which is included in all memberships.
We posted a YouTube video today, as mentioned at the beginning of the newsletter, and we have useful and educational playlists, so give our channel a look if you’re curious about recent market commentary and ideas as well as gamma (GEX) concepts explained.
Thanks for being part of our community and know that we invite your feedback!
The information provided by Geeks of Finance LLC is for educational purposes only and is not intended to be, nor should be construed as, an offer, recommendation or solicitation to buy or sell any security or instrument or to participate in any transaction or activity. Please view our Investment Adviser Disclaimer and Risk Disclosure.