
Entering A New OpEx Cycle
SUMMER PORTFOLIO MANAGER ANNUAL SUBSCRIPTION PROMO- We’re currently offering $300 off of the annual Portfolio Manager subscription, which includes access to our full GEX dashboard, a 5-hour Geek University course, full Discord access including trade ideas, and our daily livestream. Take advantage now, deal with the summer heat on your own, but let our tools remove some heat from your portfolio! Enter code SUMMER2025 at checkout to lock in a great annualized cost for access to our highest level subscription!
Today’s YouTube video takes a complementary view of major indices as well as delving into some individual names with relevance to the broader indices like AMD, which clearly influences the Nasdaq as a big component of the semiconductor sector. The video can be viewed by clicking here.
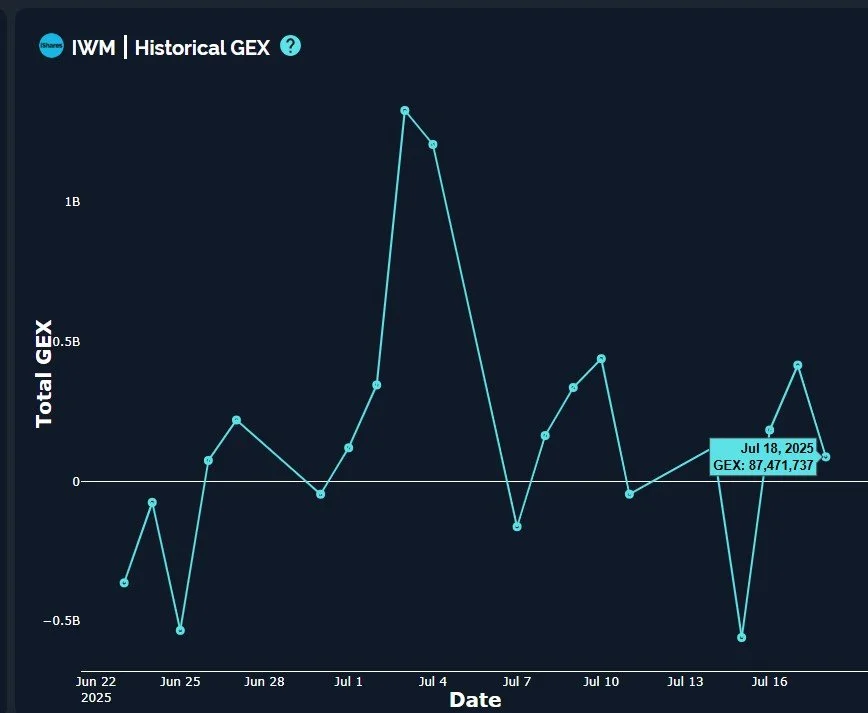
Let’s take a look at the major US indices as we approach the beginning of a new OpEx cycle, starting with IWM: IWM has been the most bullish of the US indices as of late, with a rising daily Keltner channel that has almost touched our upper Dealer Cluster zone (where we expect dealers might become sellers) at 230. 230 remains a solid near-term target, but note the total net GEX (regardless of expiration, which is implied by “total”) is largher at 210 than it is at 235, and daily volume Friday was higher at 210-213 than at any strike above 220. We’ve emphasized the concentration of IWM GEX at higher strikes as being more focused on September than on the immediate future, and Friday’s action and GEX readings somewhat vindicate that view.

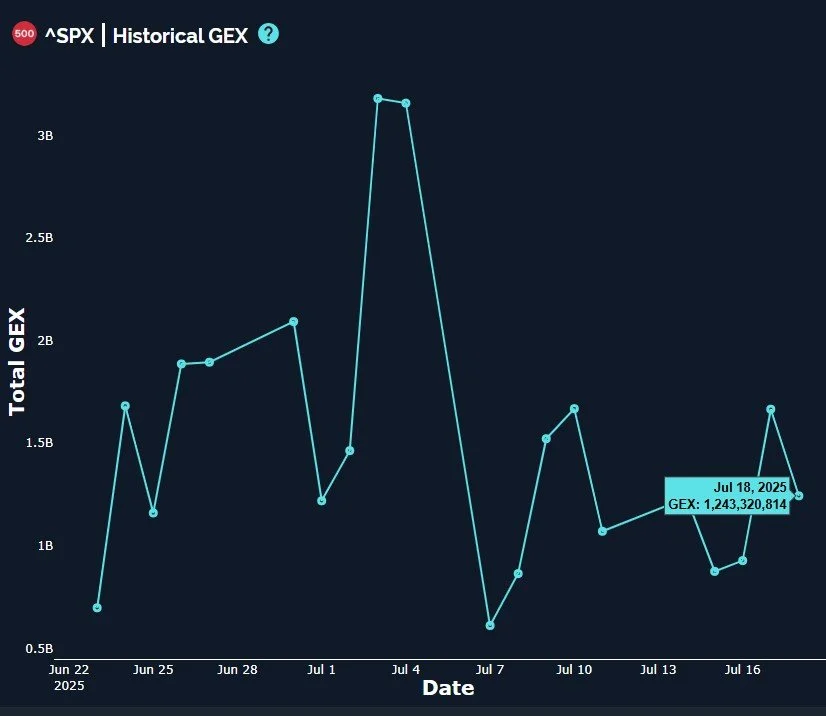
A similar theme we’ll see with SPX as well as IWM is a declining net GEX number as of Friday’s close, almost back to negative in the case of IWM. This divergence potentially implies forward caution despite Friday’s move higher in price (at least for SPX).
As we transition to a discussion on SPX, I’ve noted the distance/space between the daily upper daily Keltner channel and the growing GEX at 6500, which introduces uncertainty in terms of the relationship between price and time as we see that the weekly chart is almost perfectly aligned with the weekly upper Keltner channel. For instance, the weekly chart implies that 6500 is fair game and could occur at any moment, since we’re also above the weekly Hull Moving Average as well.
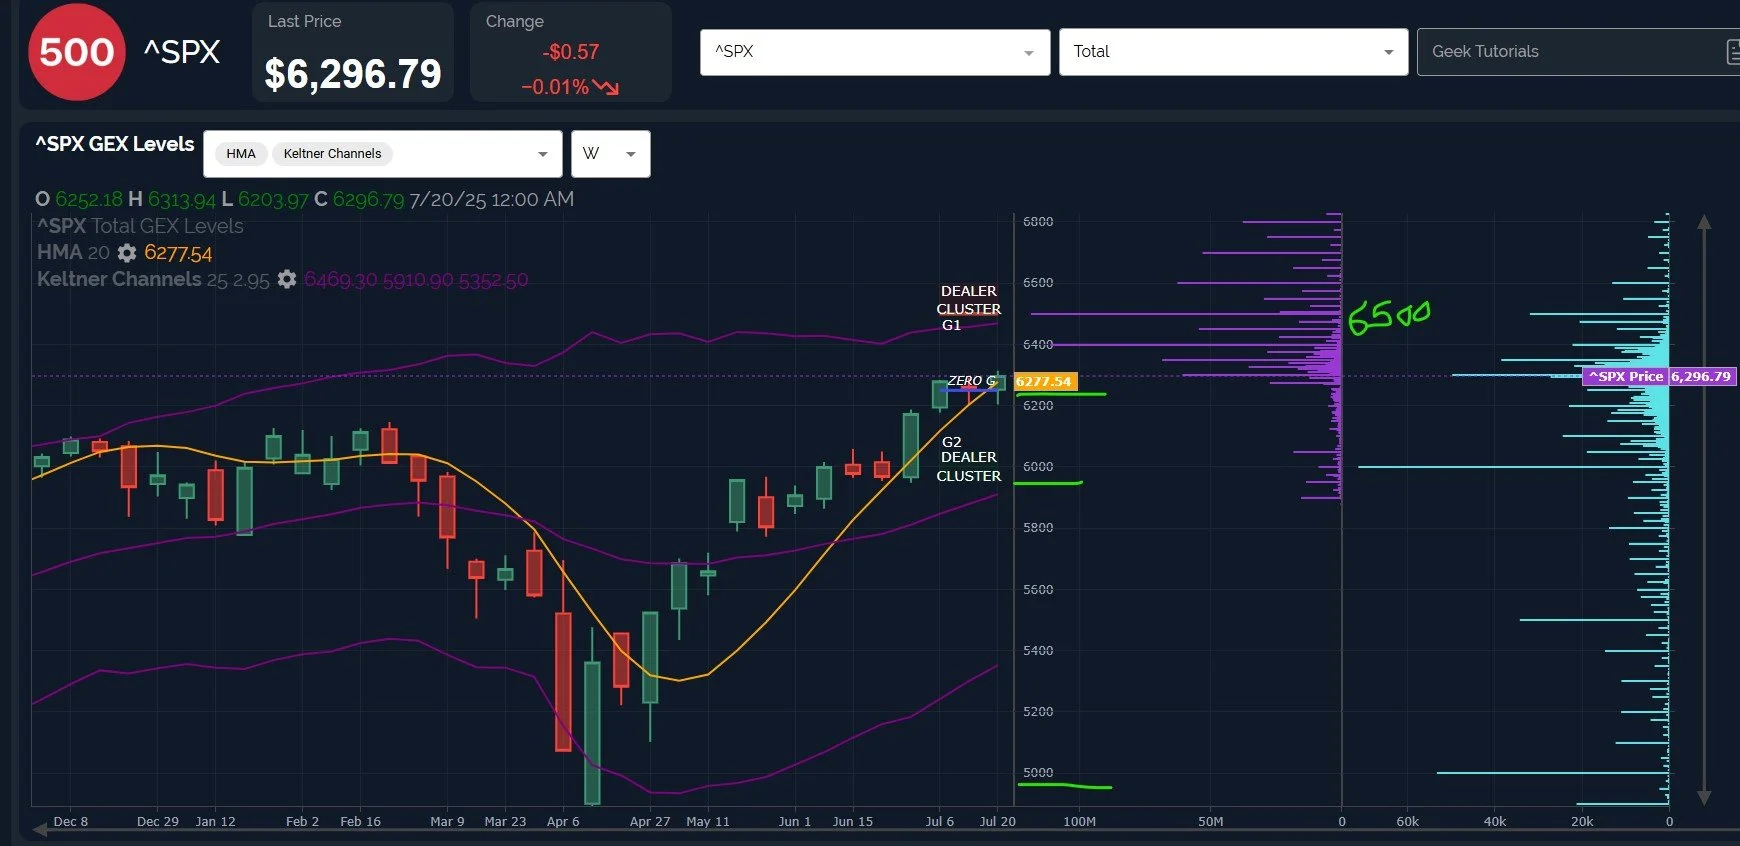
But the daily chart shows price much more delicately sandwiched between the Hull at 6295 and the upper Keltner channel at 6317. The daily chart+the weekly chart implies (in my view) that 6500 is possible, but it’s somewhat unlikely until more time passes by, allowing the daily chart to also catch up with that 6500 GEX concentration. The 3D graph amazingly shows 6500 spread between July 31 and September 30, a fairly wide range of potential target dates to reach 6500, also backing the idea that we could see a brief pullback and then stretching for a short-term market high around the beginning of August. Note that Friday’s heaviest volume was at the 5000 and 6000 strikes, both lower than the current price (clearly 5000 is less likely than a more typical 5% correction after a strong move higher like we’ve seen).

As mentioned earlier, SPX saw its net GEX decrease, though SPX still maintains a bullish 1B+ net reading.
The VIX is the last thing on our menu for today, showing a close just below the Hull Friday, yet close enough to worry about a sudden retaking of the line and propelling higher, especially in light of the volume at higher strikes and previous months giving credibility to support around the 16-17 area.

Another short-term signal for volatility worth watching is the 2-hour chart holding the Hull support for the VIX. I especially like the 2-hour chart for the VIX in particular, as it recently appears to be very relevant in identifying shorter term pivots. The implication is that as long as 16.37 is held, 18+ is a possibility. We continue to see evidence backing an eventual resolution higher into early Fall, but the risk of an immediate pullback looms thanks to a possible case of “too far, too fast.” Keep up with us in Discord and we’ll make a point to share intraday updates that will add confidence to the pathway decided in coming days (link below)!

Here’s the link to our Discord server if you haven’t joined us yet! Discord is our most active social media setting. Access is free for some channels, and new members have a 7-day trial within Discord to see how we operate. We have an active community of thoughtful and experienced traders who chime in throughout the day, and several channels dedicated to intraday and weekly trading.
If you’re interested in accessing our tools and analytics, be sure to check out our website! Mobile updates are now live for a better mobile experience and both subscription tiers have access to our full list of tickers!
If you’re interested in learning more about our strategy and approach, we address all of these topics in our Geek University course which is included in all memberships.
We posted a YouTube video today, as mentioned at the beginning of the newsletter, and we have many other short videos, so give our channel a look if you’re curious about recent market commentary and ideas as well as gamma (GEX) concepts explained.
Thanks for being part of our community and know that we invite your feedback!
The information provided by Geeks of Finance LLC is for educational purposes only and is not intended to be, nor should be construed as, an offer, recommendation or solicitation to buy or sell any security or instrument or to participate in any transaction or activity. Please view our Investment Adviser Disclaimer and Risk Disclosure.