
SPX: Net GEX Vs Gross GEX
While all major indices closed red for the day, a really noticeable divergence was present for even longer, with QQQ down a lot compared to SPX. The semiconductors were largely responsible for this, even with a lot of the Magnificent Seven solidly positive. While IWM is beginning to show some concerning technical signs, SPX and QQQ are still holding above key levels, keeping open the possibility of a spike back toward highs.
Members save a special $375 on the annual Portfolio Manager plan with code FREEDOM26 at checkout, which will run through the July 4 holiday.
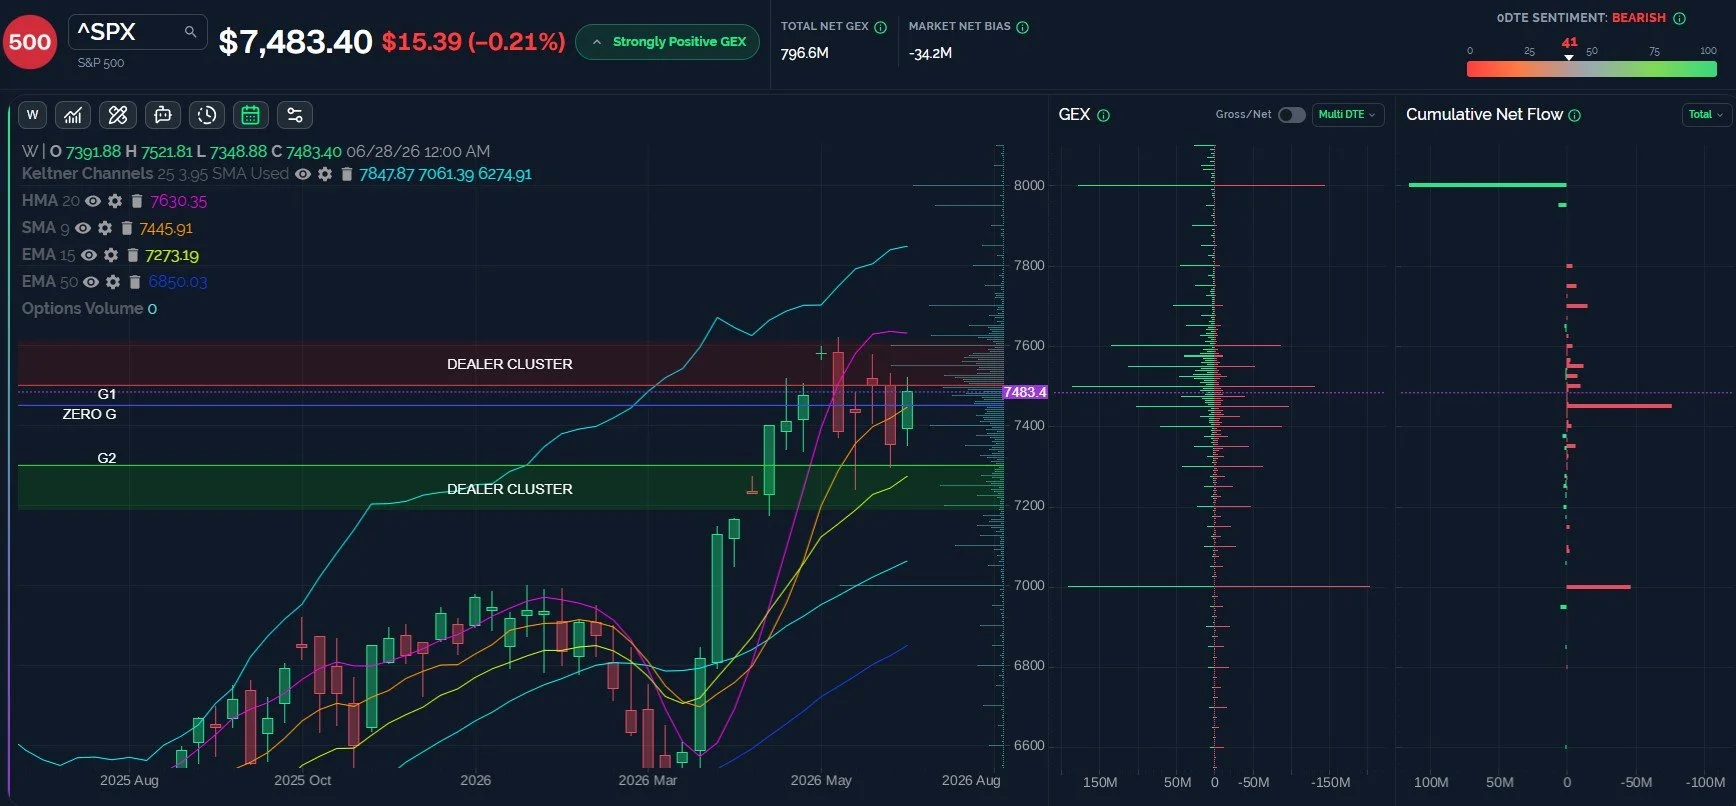
SPX Holds The Weekly 9 SMA, Battleground Between 7400-7600
SPX staged a solid opening bounce off of the weekly 9 SMA, with 7449 holding as the intraday low. I’ve selected gross GEX on the weekly chart below to illustrate the importance of the 7400-7600 zone, with large GEX clusters every 50 points. One interpretation is that SPX may be bound between these strikes for a lengthy consolidation. Regardless of how long SPX trades within the zone, it also may be significant if and when SPX trades outside the zone, with a daily close above 7600 or below 7400 potentially opening the door to a trending move away from the box.
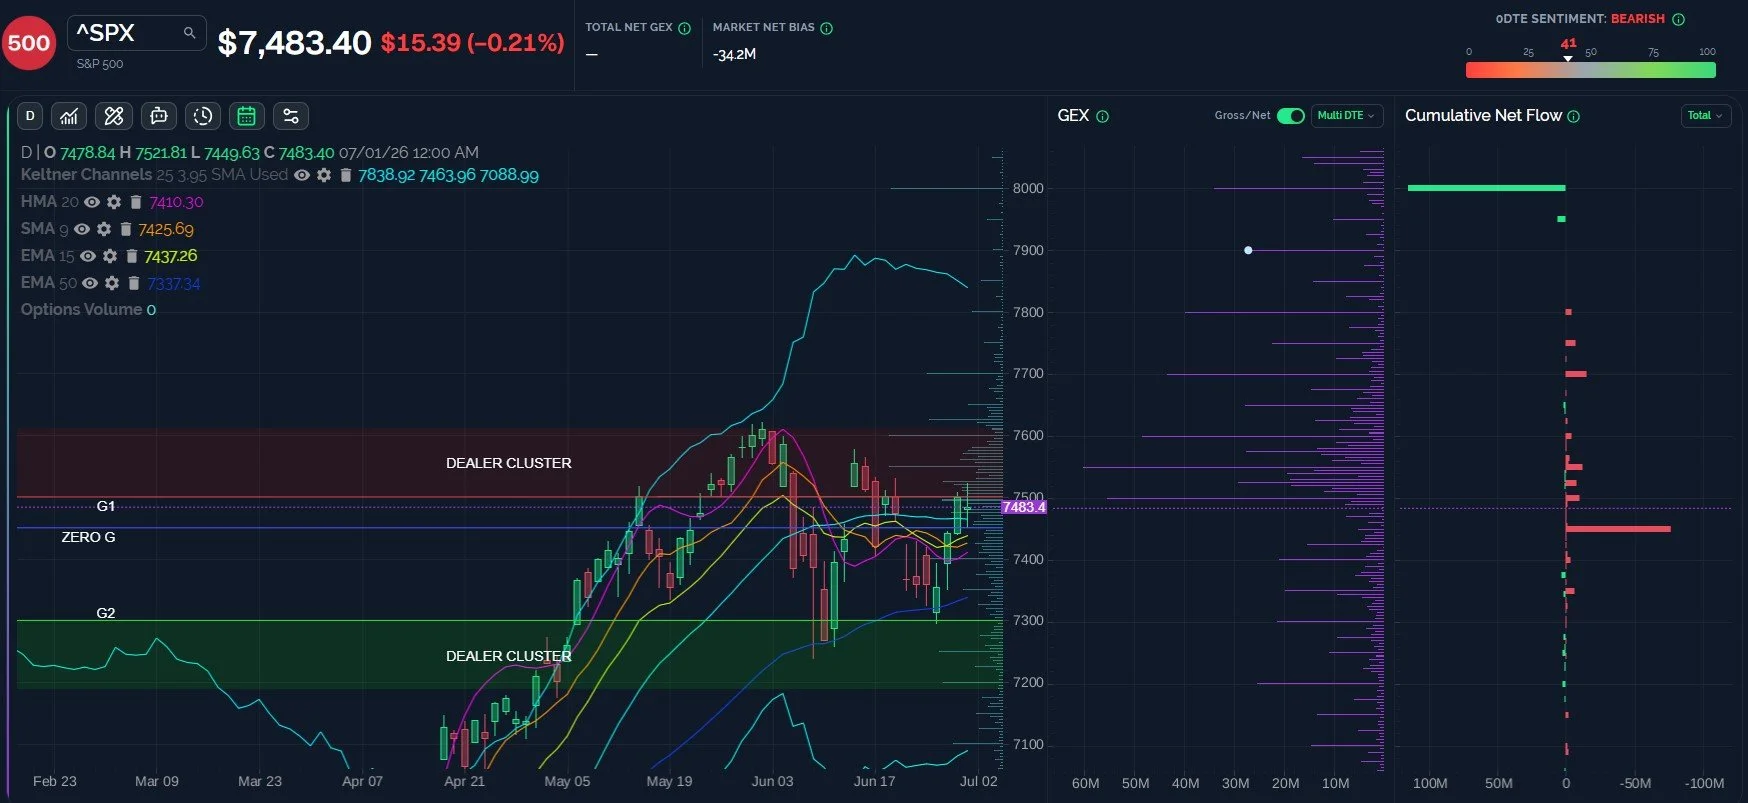
SPX Net GEX Is Mostly Higher
The net picture shows 7550 as the largest net GEX cluster, and the 7600-7800 strikes in particular show large net positive GEX. With SPX holding above 7425, the odds seem to favor a test of 7550, and then 7600. SPX can drop as low as 7410 and still maintain the potential for a move higher, based on the daily HMA. Several indicators support GEX in identifying 7400 as key support.
Key Levels: Bullish above 7500 targeting 7550, then 7600. Bearish below 7475 targeting 7450, then 7410.
QQQ Still Holds Potential To Reach 740
As long as QQQ holds above 720, the chart and GEX can suppport a move toward 740-750. We suggested the possibility of a rotation to the Mag 7 names if semiconductors fell, and we’ve at least had a taste of that in the short term. We’ll continue watching how this trade unfolds in coming days.
Key Levels: Bullish above 720 targeting 740, bearish below 720 targeting 715, then 700.

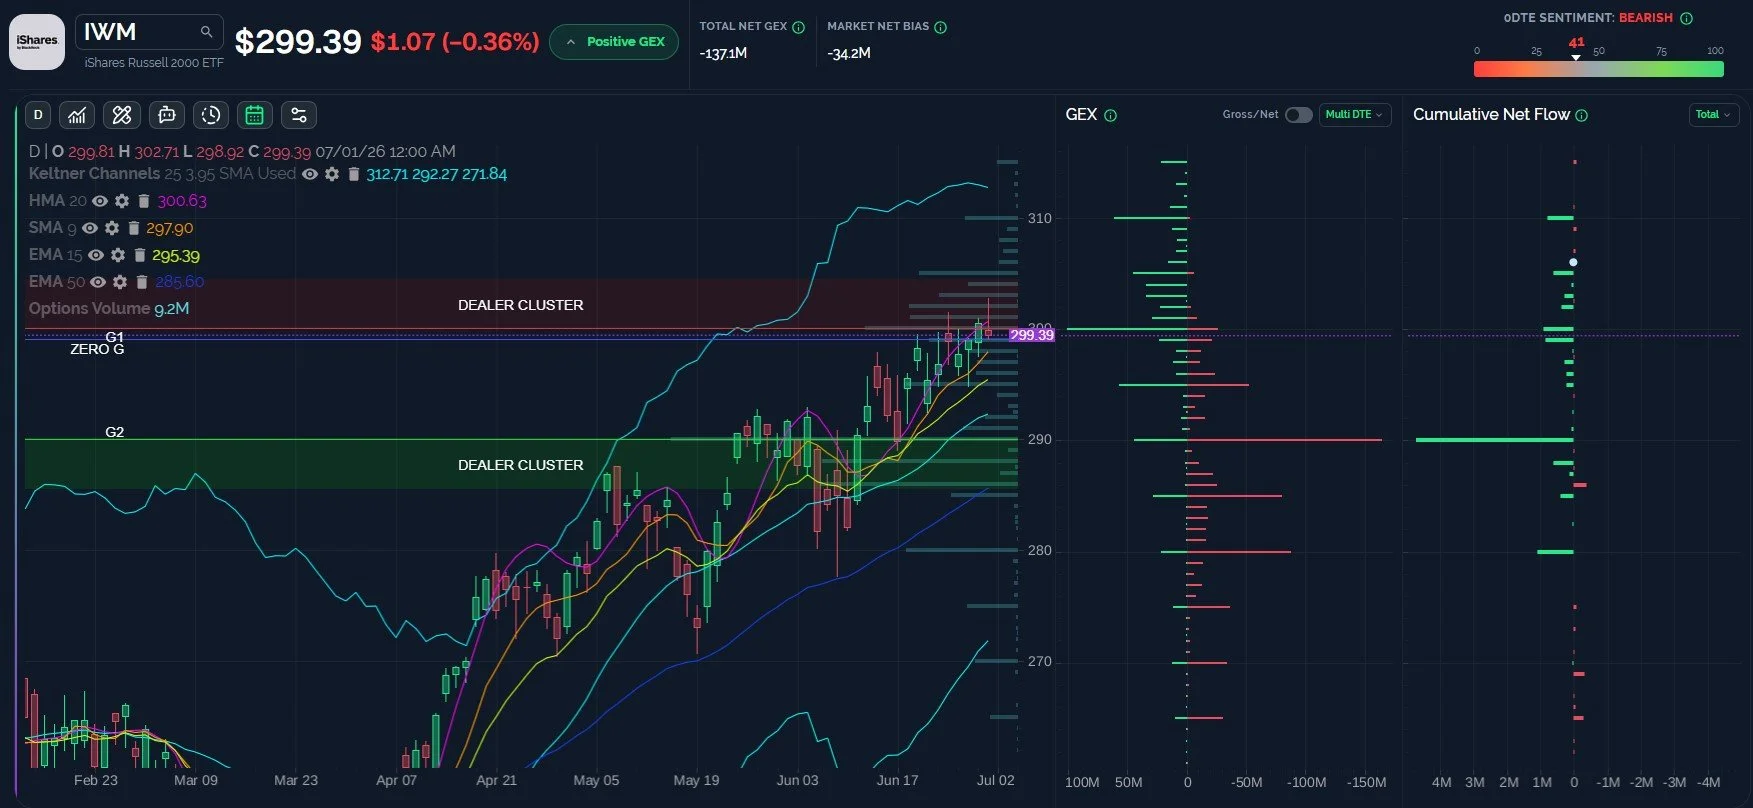
IWM’s Candle Reflects Eager Selling, Close Below The HMA
IWM attempted to move above 300 again, actually almost reaching 303 before rejecting the move above 300. The rejection left a nasty wick on the daily candle, potentially reflecting eager sellers. This combined with the close below the HMA raises the possibility that IWM may head toward 290, though it needs to break through 297.90 first. A move above 300 still carries potential to reach 310, and IWM is right at the doorstep, so the uptrend is not broken yet by any means.
Key Levels: Bullish above 300 targeting 310. Bearish below 297 targeting 290.
Join The discussion
Tonight’s YouTube video discusses SPX, the VIX, BTC, AMD, NVDA, and META, so check it out if you have a few minutes! This video and prior videos can be viewed by clicking Community at the top of our homepage to find our YouTube channel link.
Non-subscribers can join through Community on our homepage. First-time guests get a free 7-day trial of the premium Discord channels, where we talk through what is happening in real time.
We run a livestream from the homepage every day around 10:30am ET, and you can replay the most recent one any time before the next.
Thanks for being part of our community and know that we invite and appreciate your feedback!
The information provided by Geeks of Finance LLC is for educational purposes only and is not intended to be, nor should be construed as, an offer, recommendation or solicitation to buy or sell any security or instrument or to participate in any transaction or activity. Please view our Investment Adviser Disclaimer and Risk Disclosure.