
INdices Continue Toward Weekly Resistance
Indices fulfilled another positive day after recapturing daily HMA resistance Monday, placing more distance between the “Danger Zone” on the daily chart and the current price. With the VIX approaching 16 again, a potential contrarian volatility bottom, we may see a pullback soon, but higher targets for SPX are likely to be reached as long as support holds.
Members save a special $375 on the annual Portfolio Manager plan with code FREEDOM26 at checkout, which will run through the July 4 holiday.
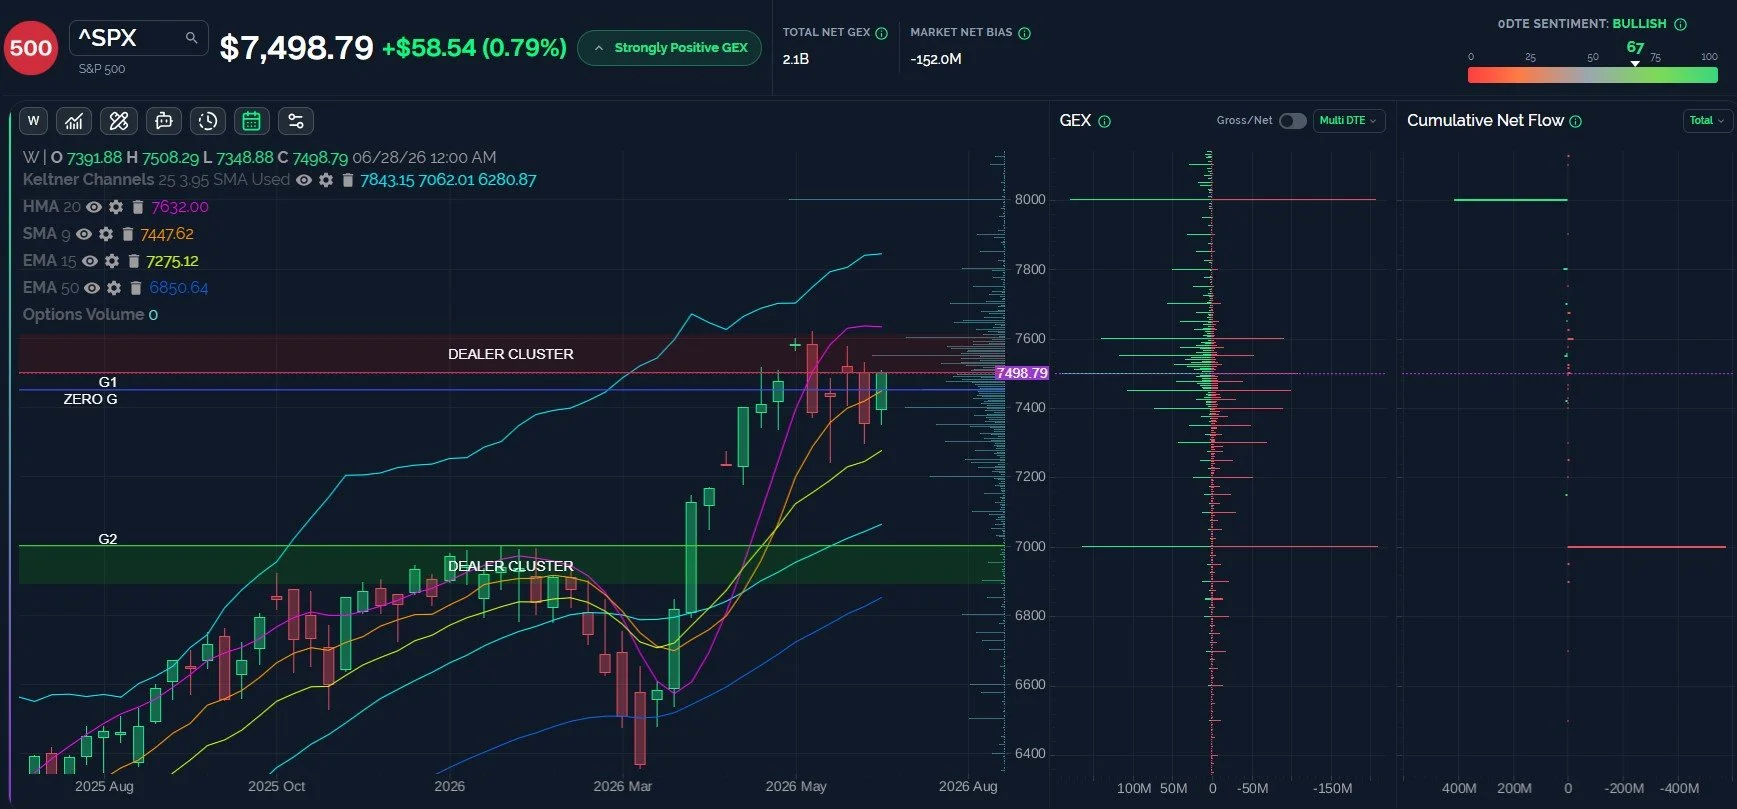
SPX: Headed For A Retest Of 7550, 7600
Yesterday we mentioned that SPX’s close looked bullish, and today seemed to confirm that with follow-through to the upside. GEX suggests potential targets overhead at 7550 and 7600, and I’m watching the weekly HMA at 7632. That line is now sideways instead of angling higher, and we do see a lack of GEX between 7600 and the next big cluster at 8000. All things considered, I think risk exists that we may see a wide, choppy range if we don’t decisively close above 7600 or below 7000. As for levels a little closer to today’s close, SPX could retest the daily HMA at 7400 and still maintain potential for the spike to 7600, if we don’t see 7600 first. SPX is 100 points above the daily HMA, so mean reversion back to that line is a real risk, in my view.
Note a new tool we just added: Cumulative Net Flow. This displays the net options flow accumulated at each strike price, and given that it was the last day of the quarter, we see “someone (wink wink)” was busy pushing and pulling on 7000 and 8000.
Key Levels- bullish over 7500 targeting 7600, then 7632. Bearish below 7500 targeting a retest of 7447, then 7400.
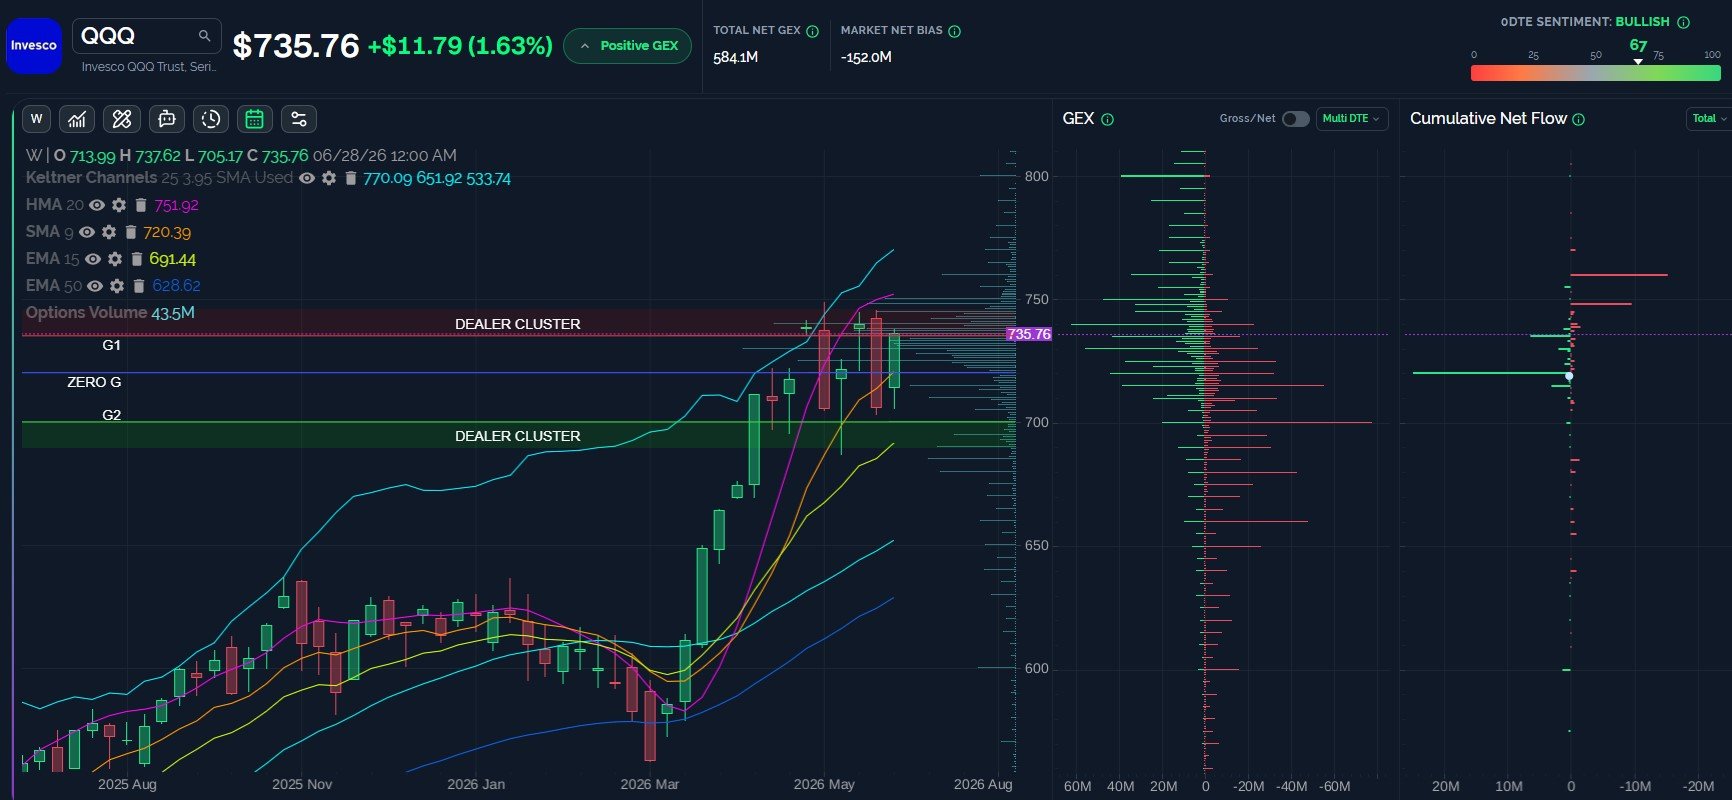
QQQ: Mag 7 Looks Gross, Still Headed For 740-750
I can’t remember a recent time when the Mag 7 names were so persistently ugly, and that might be a warning sign that this move resolves to the downside. Instead of having to guess the future and complain about headlines no one can foresee, we will take it level by level and let the price action tell us how to react. The GEX picture suggests 740-750 is likely to be tested, representing the weekly HMA just overhead at 751.92. Today saw a gap filled on the daily chart as well, so we could see some consolidation anywhere between today’s closing price and the 750 area. Any drop toward 720 (the 9 SMA and an important GEX zone) needs to hold in our view, with a retest of 700 possible below 720.
Key Levels: Bullish above 730 targeting 740, then 750. Bearish below 730 for a retest of 720, then 700.
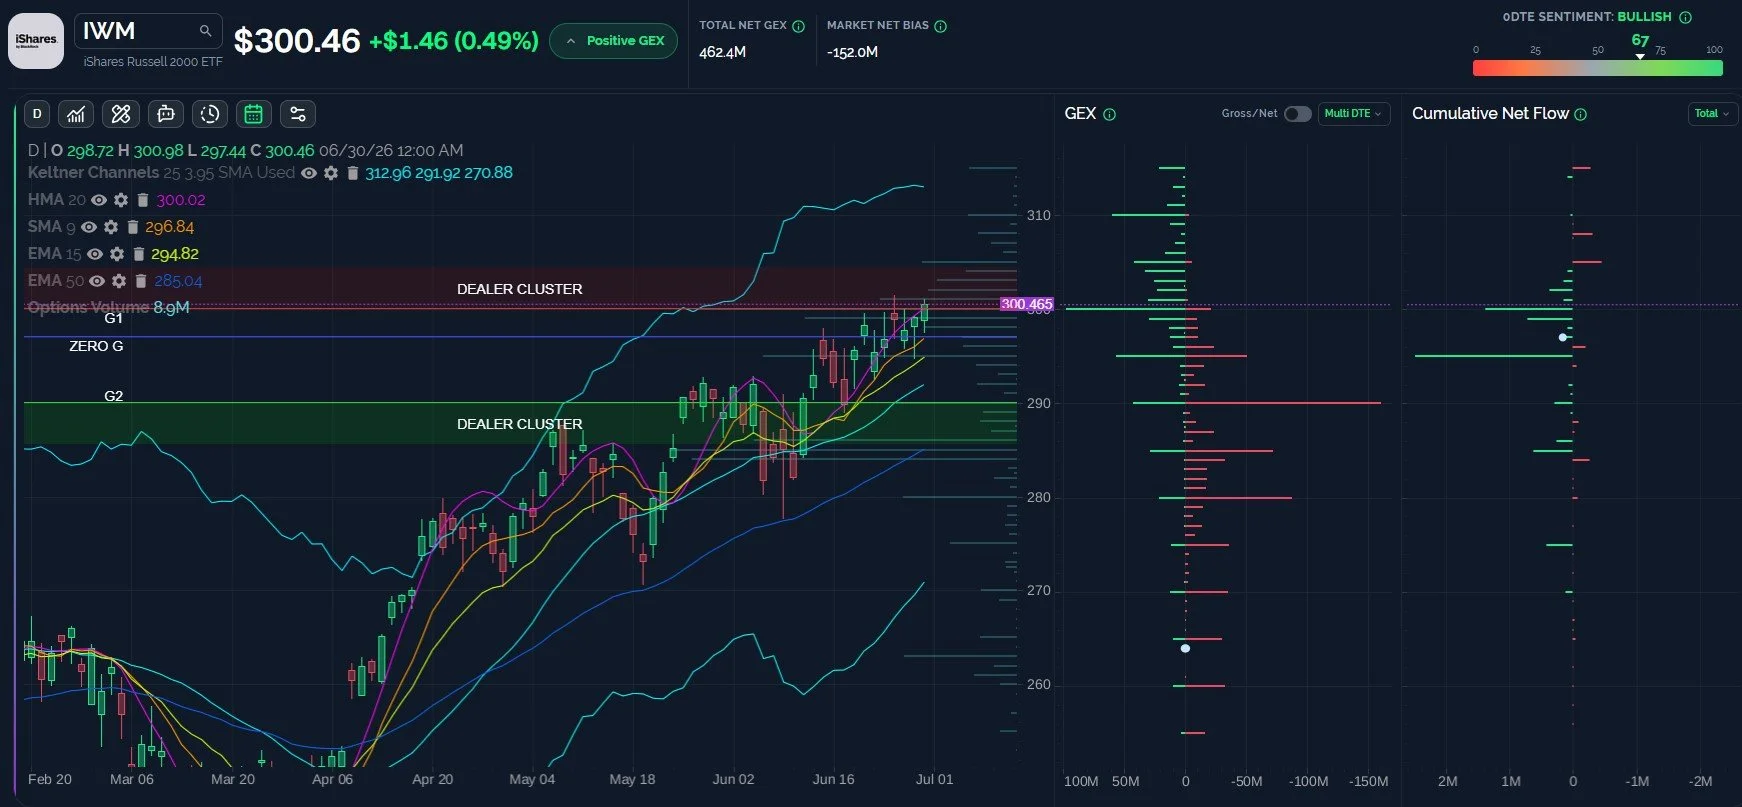
IWM Set A New Closing High
IWM hasn’t tested the intraday high from 4 trading sessions ago, but IWM did make a new closing high today, retesting 300 and resting right at the daily HMA. It’s possible IWM reaches for 310 and makes a new high, and I think the odds are slightly better than the flip of a coin, given recent momentum higher. The GEX picture doesn’t look quite as certain, with a lot of the GEX sitting at lower strikes, but IWM does have a shot at 310 as long as any drop holds above 290.
Key Levels: Bullish above 290 targeting 310, bearish below 290 targeting 280, then 270.
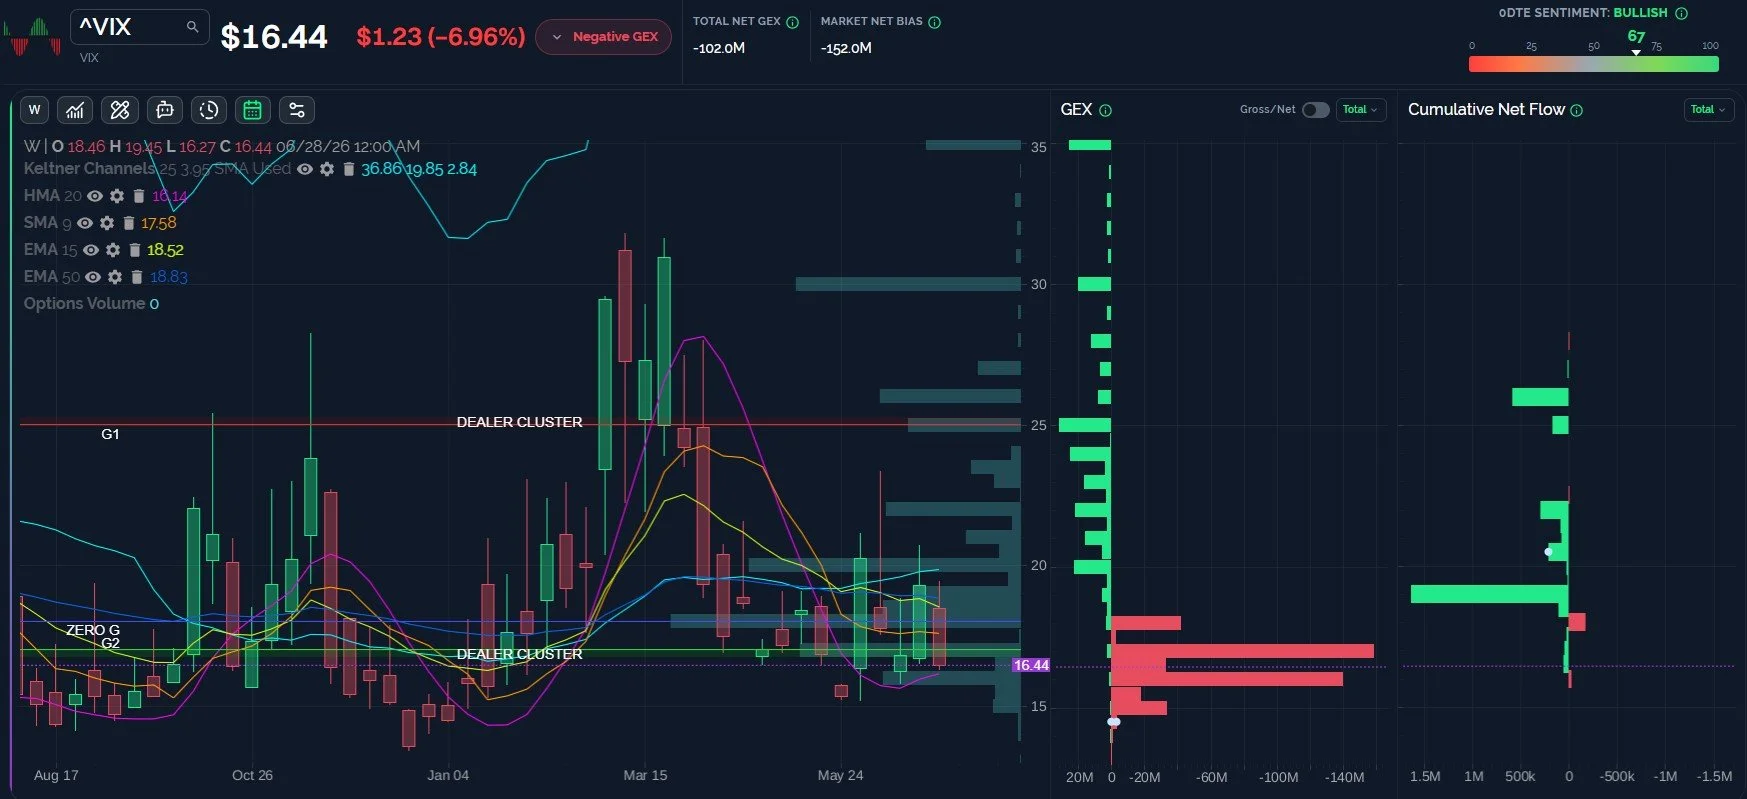
The VIX May Be Approaching A Contrarian Low
The VIX has moved toward the 16 strike is a straight line, driving the VIX into oversold territory using the %b indicator and bringing the VIX to the lower Keltner channel on the 2-hour chart. Today’s low also represented a test of the weekly HMA, so the VIX is within a zone that could mark a reversal for volatility. The burden is on the bears to prove any spike to be anything but a retest of overhead resistance between 18-20. Until 20 is captured, we’re likely in a strong buy-the-dip environment with indices, in our view.

GEX And The VIX Weekly Suggest SLowing DOwnside Momentum
The VIX retest of the weekly HMA coincides with large negative GEX at the 16 and 17 strikes, and very little GEX exists below 15. A consistent theme all year has been higher lows for the VIX, with 15 appearing to be a likely floor. We may see the VIX trade within this range of 15-20 until something shakes volatility from its slumber, so we’ll be watching for clues to add context to any potential changes ahead.
Key Levels: The VIX may reach 15 if 16 is lost. Odds favor 16 holding, with any rebound targeting 18-20 resistance.
Join The discussion
Tonight’s YouTube video discusses SPX, QQQ, AMD, DE, and IGV, so check it out if you have a few minutes! This video and prior videos can be viewed by clicking Community at the top of our homepage to find our YouTube channel link.
Non-subscribers can join through Community on our homepage. First-time guests get a free 7-day trial of the premium Discord channels, where we talk through what is happening in real time.
We run a livestream from the homepage every day around 10:30am ET, and you can replay the most recent one any time before the next.
Thanks for being part of our community and know that we invite and appreciate your feedback!
The information provided by Geeks of Finance LLC is for educational purposes only and is not intended to be, nor should be construed as, an offer, recommendation or solicitation to buy or sell any security or instrument or to participate in any transaction or activity. Please view our Investment Adviser Disclaimer and Risk Disclosure.