
New Highs For SPX!
NEW PORTFOLIO MANAGER ANNUAL SUBSCRIPTION PROMO- We’re currently offering $200 off of the annual Portfolio Manager subscription, which includes access to our full GEX dashboard, a 5-hour Geek University course, full Discord access including trade ideas, and our daily livestream. Take advantage now, it won’t last long! Enter code JUNE2025 at checkout to lock in a great annualized cost for access to our highest-level subscription!
We finally did it! SPX reached 6100, a new all-time high. In yesterday’s newsletter, we indicated that this would be a high probability target with a gap up from yesterday’s close narrowly above the Hull Moving Average, and that’s exactly what happened. Despite the “if..then” confidence, predicting continuation was anything but easy, even using the combination of GEX positioning and indicators that we like to use. Reaching 6100 did seem inevitable at some point, as noted by the continued growth in positive GEX at higher strikes for SPX. Now that a pathway has been chosen, and the initial upside target quickly reached, we need to pay attention to the downside risks that exist in the background.
It’s hard to believe we’ve barely had a noticeable pullback since late May (and even that was modest), but the Keltner channels are angled upward in bullish fashion and the Hull is starting to turn back up again, never really assuming a more definitive downward slope, except in the case of IWM for a time. We still see a big GEX cluster at 6000, which has been quite persistent, though this time around, 6100 dwarfs 6000 in comparison.

The upper Dealer Cluster zone extends from 6100 all the way to 6200, with the upper Keltner Channel right in between, giving us a range of upside targets (starting right here at 6100) that could mark a reversal lower for another “real” pullback. Given the GEX situated at every century mark from 6200 up to 6500, a drop to 5800-5900 would be a welcome dip buying opportunity before a potential ride toward the higher targets, in theory. Initially, a retest of the Hull at 6034 wouldn’t be surprising at all, and perhaps one last push toward 6200. GEX can help us to narrow down the time frame, but only to a point, so it’s hard to say whether or not this entire process of reaching 6200 happens this week or over a slightly longer amount of time.
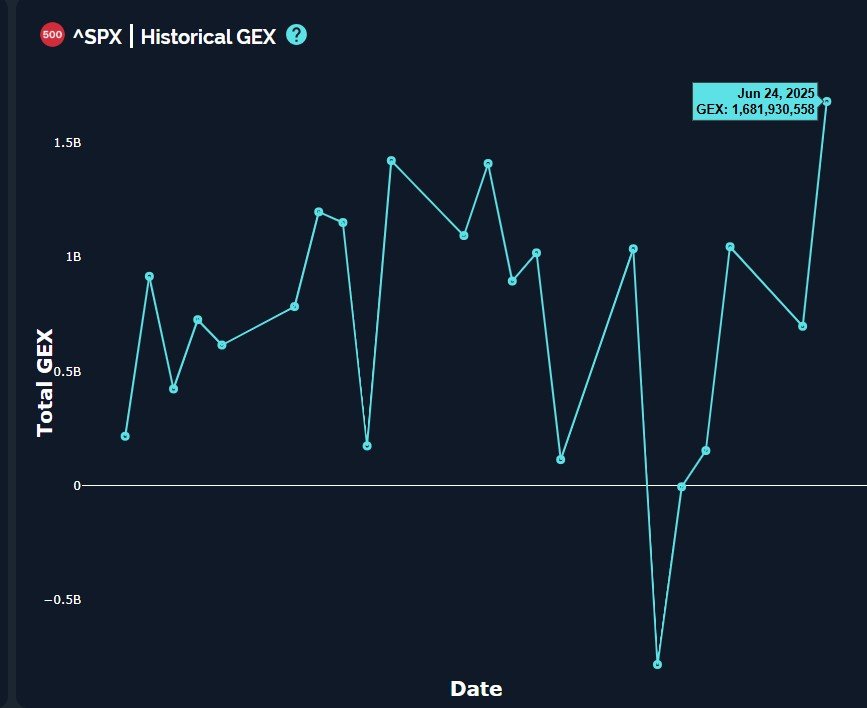
SPX net GEX has reached 1.68B, a reading not all too common, and lately, high GEX readings have preceded pullbacks in close proximity, sometimes even giving an advanced warning of a day or two. The reading itself is bullish though, and as long as positive GEX remains, the environment will be a buy-the-dip & hold on for the rip (but don’t let your mouse finger slip) sort of party.
QQQ has finally reached the 540 target, and we have enough GEX at 545 and 550 to consider those targets as possible in coming days. Somewhat worrisome is a lack of meaningful GEX clusters at lower levels. This may imply just how bullish the market is right now, but any left field negative surprise could see a sharper pullback in the absence of large GEX clusters to help cushion or slow a drop. The best defense QQQ has right now is that the underlying holdings have a lot of overlap with SPX and SPY, and with GEX positive, the overall action of dealers may act to dampen volatility to the downside.

Similar to SPX, QQQ’s net GEX moved higher, also accompanying recent market tops just as we saw with SPX.

The VIX took a definitive dive into the basement with a huge gap down today, almost reaching the largest negative GEX cluster at 17. The speed with which the VIX reached this area may hasten a reactive rebound back up for volatility, but it also presents a number of resistance areas overhead that make any market pullback with accompanying VIX spike unlikely to see the VIX reach 40 or 50 (unless we see some sort of black swan event, by definition), but 20-21 would be easy to envision as an initial target once a pullback starts. The VIX behavior at that juncture may determine whether we reject and head toward new lower lows for the VIX this year, maybe toward 14-15, or if 17 will continue to mark a general bottom area going forward, with higher VIX levels to come. Looking back over the last 2 months, this is not an area where I would want to be short volatility, I would rather stay long the tickers I like and buy cheap hedges instead. But to each their own!

The 2-hour VIX chart bottomed intraday within 5 cents of where we mentioned the VIX might turn back up while discussing the action in Discord, retaking the rapidly declining Hull and triggering a VIX long signal right at the end of the day. It’s not without precedent to see the VIX violate the 2-hour Keltner channel, but the decline of the Hull to the lower Keltner channel increases the odds that we see some sort of reversal here. In the event of a pullback, we’ll watch what happens at 20-21, if we get there. Until then, it’s always tricky to pick tops, so we generally avoid it, though we want to pay attention to our hedges and protecting profits on longs right now.

Here’s the link to our Discord server if you haven’t joined us yet! Discord is our most active social media setting. Access is free for some channels, and new members have a 7-day trial within Discord to see how we operate. We have an active community of thoughtful and experienced traders who chime in throughout the day, sharing ideas and opportunities as we see them.
If you’re interested in accessing our tools and analytics, be sure to check out our website! Mobile updates are now live for a better mobile experience and both subscription tiers have access to our full list of tickers!
If you’re interested in learning more about our strategy and approach, we address all of these topics in our Geek University course which is included in all memberships.
We won’t be posting a YouTube video today, but we’ll resume tomorrow. We have many other short videos, so give our channel a look if you’re curious about recent market commentary and ideas as well as gamma (GEX) concepts explained.
Thanks for being part of our community and know that we invite your feedback!
The information provided by Geeks of Finance LLC is for educational purposes only and is not intended to be, nor should be construed as, an offer, recommendation or solicitation to buy or sell any security or instrument or to participate in any transaction or activity. Please view our Investment Adviser Disclaimer and Risk Disclosure.