
Preparing to Buy The Dip
NEW PORTFOLIO MANAGER ANNUAL SUBSCRIPTION PROMO- We’re currently offering $200 off of the annual Portfolio Manager subscription, which includes access to our full GEX dashboard, a 5-hour Geek University course, full Discord access including trade ideas, and our daily livestream. Take advantage now, it won’t last long! Enter code JUNE2025 at checkout to lock in a great annualized cost for access to our highest-level subscription!
We’re finally beyond VIX monthly expiration and index OpEx week, as well as FOMC, fortunately. We’re looking forward to seeing more movement, which we hope will follow last week’s chopfest. Indices are mostly right where they were 5 days ago, boringly. We go over the indices in-depth as well as several major market leaders in today’s YouTube video, which you can view by clicking here.
We’re seeing a sharply different picture painted by the underlying GEX for QQQ, SPY, and SPX, though they all have a similar chart. With these indices sharing many of the same top holdings, price action will obviously be similar for SPX and SPY, and likely also for QQQ, so the GEX divergence will have to resolve itself with one (or two) indices being more correct than the other. Which will it be?

Let’s particularly focus on QQQ and SPX tonight, with brief mention of IWM and SPY. Starting with QQQ above, we see price holding below the Hull Moving Average, which is an indicator I like to use for prevailing direction. The continued presence of higher GEX is at odds, or perhaps the timeframe required is at odds with the immediate signal from the Hull that 532.92 is now an important resistance level. We do see meaningful GEX below us at 520, 500, and even more so at 470, which is the largest GEX cluster below 540. I can see the technical beauty of dropping to 470, printing a higher low, then rocketing to new highs, making us all rich (or richer in some cases). But if we’re trading what’s in front of us, we have a murky picture, with reassessment appearing to be required at each stop along the way, either testing 520 first or overcoming 532.92 on a daily close and brining 540-550 into the picture very quickly.
QQQ net GEX took a dive into deeper negative GEX territory than it has seen for a month or longer, which is certainly not a bullish sign, especially with GEX still far from an extreme. We can’t definitively say QQQ guarantees more downside, but we can certainly say the drop in GEX is not bullish.

Some of you may remember my saying that when I see disagreement amongst the indices in terms of GEX, I tend to give SPX the edge, mostly due to my anecdotal personal experience in watching which reading proved to be more helpful or reflective of where we went next. This isn’t always true on an intraday basis, but more often than not, I find the rule of thumb to be helpful. Why do they have different readings? A number of factors may contribute, including the different types of participants trading each instrument, and also keep in mind no one owns SPX like you can buy SPY (SPX trades only options), so there’s no ownership of SPX shares with the possibility of an option hedge. You can do this with SPY, or you can own various SPX options and create a hedge, but certainly those differences impact the GEX readings. SPY and QQQ often seem more aligned, maybe due to retail traders that are more active in both of those as well as 401k and retirement plans, to guess a few logical possibilities.
SPX took a jump into very positive 1B+ territory, starkly contrasting with the others. I’ll note that IWM also saw a marginally positive shift, though IWM is still overall negative with 200 as a big target on the GEX map.

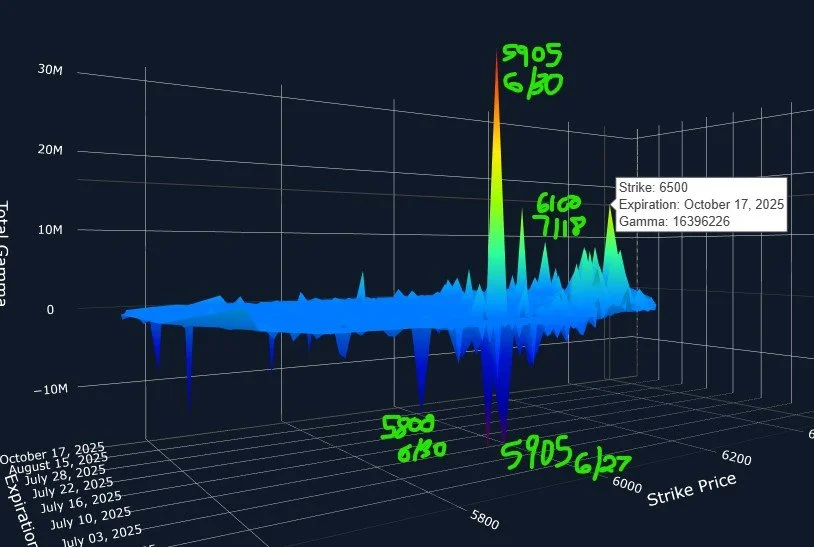
SPX’s chart looks very similar to QQQ, but we still have big GEX at 6100, and amazingly, big GEX up to 6500. The GEX at higher strikes is too much to ignore, in my opinion. 5800 is the next largest GEX cluster we see to the downside, and being below the Hull has me watching 5800 closely, but even a 3-5% pullback won’t likely shift the likelihood of moving higher as the year progresses, as we’ll look at momentarily.

SPX’s distribution of individual GEX clusters on the 3D map (which doesn’t show net GEX, rather the GEX at each strike, both positive and negative) points to lower possible targets over the next couple of weeks, then a skew higher looking especially toward September and October. My conclusion of the indices is that we have a murky picture over the next month or so, with a possibility of more downside, but that downside risk is likely a buying opportunity as long as we see positive GEX building at the later months expirations.
The VIX also contributes toward a more cautious near-term picture, gapping below the Hull Friday but closing above the Hull. We also show very limited downside for volatility, if the largest negative GEX at 17 ends up representing a floor similar to the last time or two we made it to that level. 25 still looms overhead as a possible VIX target to the upside. with noticeable volume at those higher strikes on Friday as well.
We’ll look forward to seeing you in Discord where we can share our evolving views as intraday data helps to paint a picture of what might be next. Thanks for reading and thanks for joining us!

Here’s the link to our Discord server if you haven’t joined us yet! Discord is our most active social media setting. Access is free for some channels, and new members have a 7-day trial within Discord to see how we operate. We have an active community of thoughtful and experienced traders who chime in throughout the day, sharing ideas and opportunities as we see them.
If you’re interested in accessing our tools and analytics, be sure to check out our website! Mobile updates are now live for a better mobile experience and both subscription tiers have access to our full list of tickers!
If you’re interested in learning more about our strategy and approach, we address all of these topics in our Geek University course which is included in all memberships.
We recently posted a YouTube video today, and we have many other short videos, so give our channel a look if you’re curious about recent market commentary and ideas as well as gamma (GEX) concepts explained.
Thanks for being part of our community and know that we invite your feedback!
The information provided by Geeks of Finance LLC is for educational purposes only and is not intended to be, nor should be construed as, an offer, recommendation or solicitation to buy or sell any security or instrument or to participate in any transaction or activity. Please view our Investment Adviser Disclaimer and Risk Disclosure.