
VIX Closes Green, SPX Hits Extreme GEX Territory
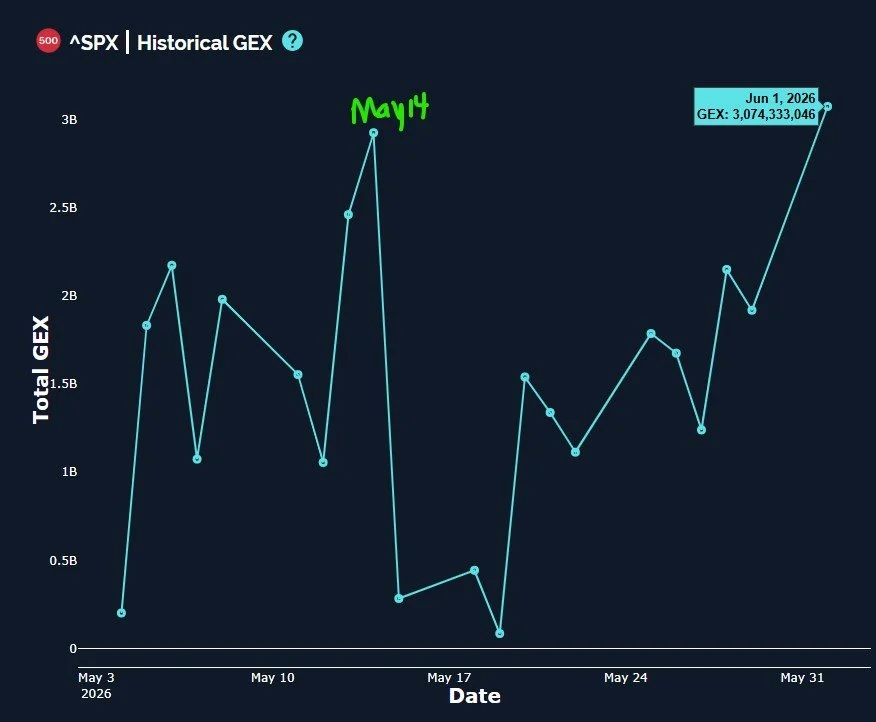
SPX reached a 3B positive GEX reading at today’s close, an extreme level that has marked tops as recently as May 14. The VIX closed green while IWM appears to show favorable odds of heading lower. Let’s take a closer look at the big picture across the board.
Members save $300 on the annual Portfolio Manager plan with code MAYFOMO at checkout, which ends June 6 (in case your FOMO extends beyond May).
Extreme GEX For SPX
We consider anything over 2.5B to mark an extreme GEX reading for SPX (members can see these readings on the GEX Data Graph via the Dashboard). Our intensity gauge compares readings to prior readings for the last 52 weeks, so we have a relative comparison when we say “extreme.” Such readings are often associated with marking tops, including the most recent top on May 14. The following days saw a modest pullback of nearly 200 points, so today’s reading may be worth considering.
Indicators Reaching Potential Turning Points
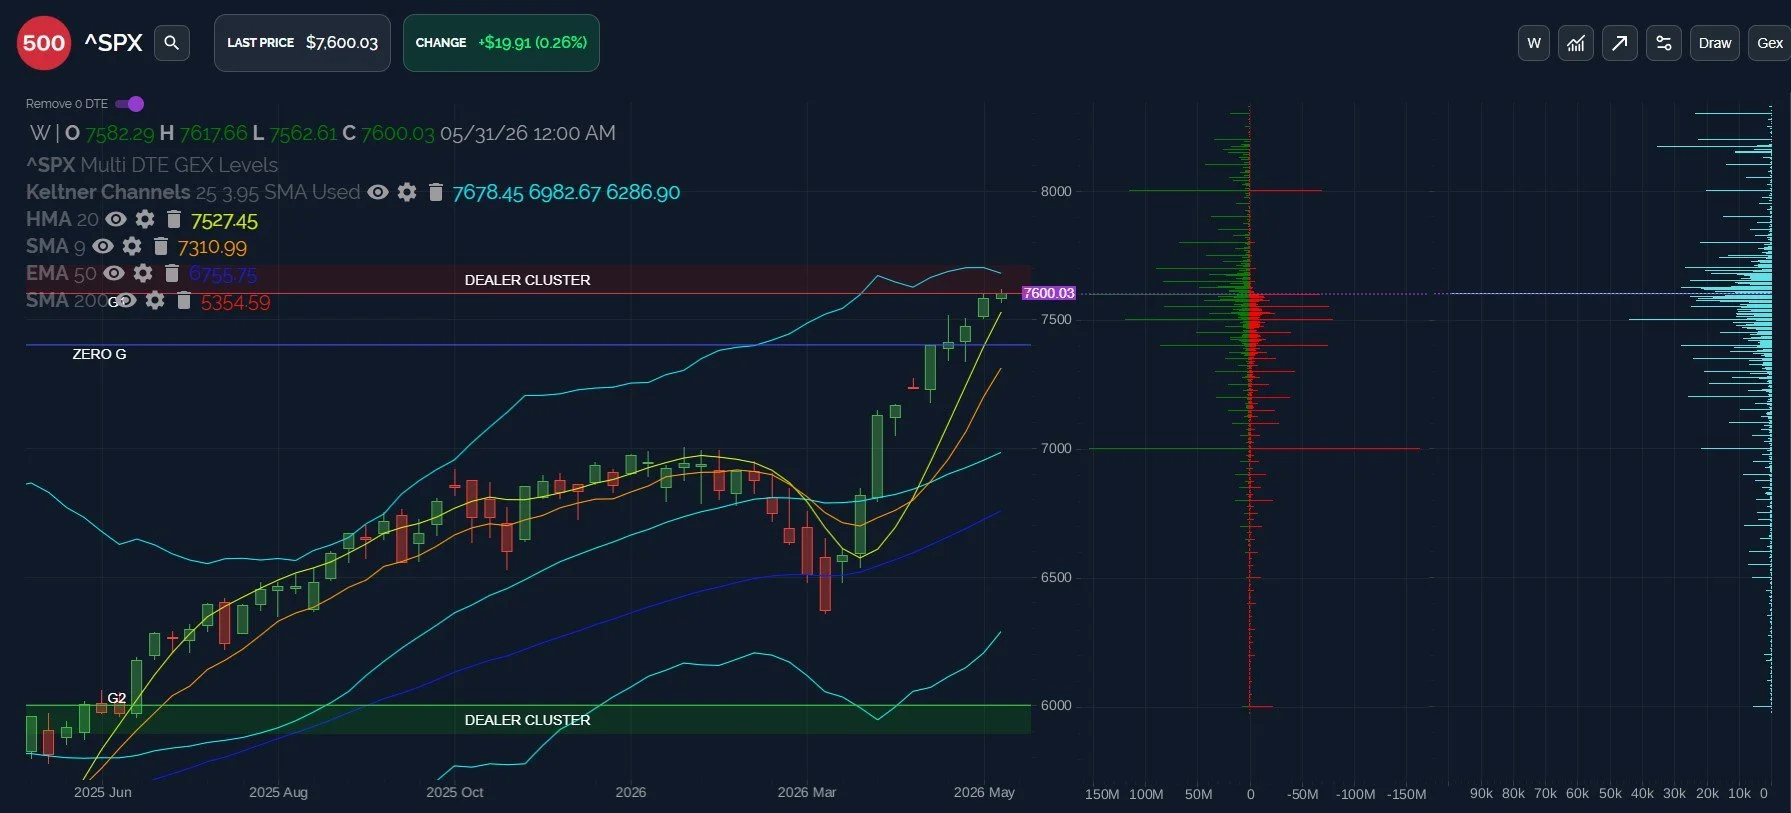
I’ve excluded 0 DTE GEX and associated 0 DTE volume from the chart below so we can focus on the GEX picture beyond today. The extreme reading we just mentioned doesn’t mean SPX is done with its move higher in the intermediate term, but in the short term, some caution may be warranted. We still see most of the positive GEX at 7600 concentrated at June 18, with the GEX at higher levels ranging from 7700-8000 sitting at later expirations, for the most part. In other words, there’s plenty of time to play with bulls’ emotions before reaching those GEX targets, in theory.
The HMA is rapidly approaching the now downward pointing upper weekly Keltner channel. The upper weekly channel is usually reason enough to expect consolidation, but now we have the HMA almost flush with that upper channel, also in the upper Dealer Cluster zone. This trifecta increases the odds of a pullback, in our opinion, but I would like to see 7527 lost in order to open the door to lower prices. 7400 appears to be the initial primary target I’ll be watching in the event of continuation lower than 7527.
Key levels: Bullish above 7527, but 7600 may continue to be a ceiling. * Extreme positive GEX and various current indicators discussed increase the risk of a countertrend pullback to 7400 before pushing higher toward 8000.
QQQ Rejecting Off Of The Upper Dealer Cluster
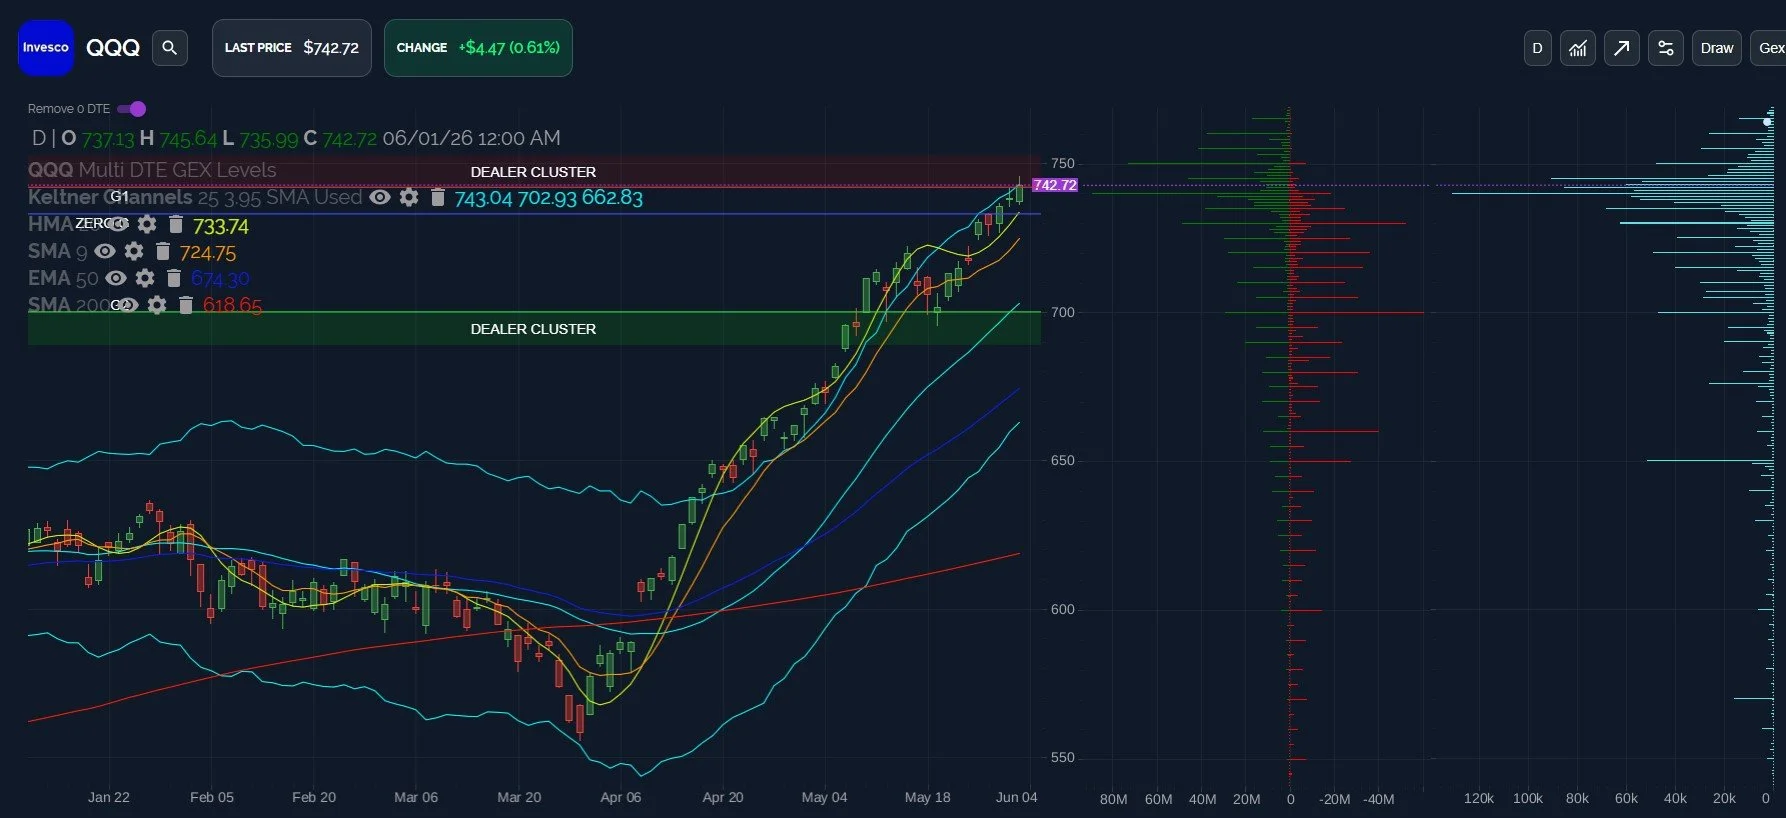
Not much has changed since our last comments on QQQ in Sunday’s newsletter. Price is extended above the weekly Keltner, we see 750 as a potential stretch target (we reached 745.64 today, so that might be “it”), and the daily chart is also looking extended. One note about the daily chart is that it looks very bullish, so even a sharp pullback toward 700 will be treated as a good dip buy on our end. As always, we want to consider the changes that occur in the GEX picture as price declines in that scenario to confirm or change our view of the 700 area.
Key levels: Bullish momentum may continue above 733. * A loss of 733 may open the door to 725 and then 700.
IWM On The Verge OF Triggering A Bearish Move?
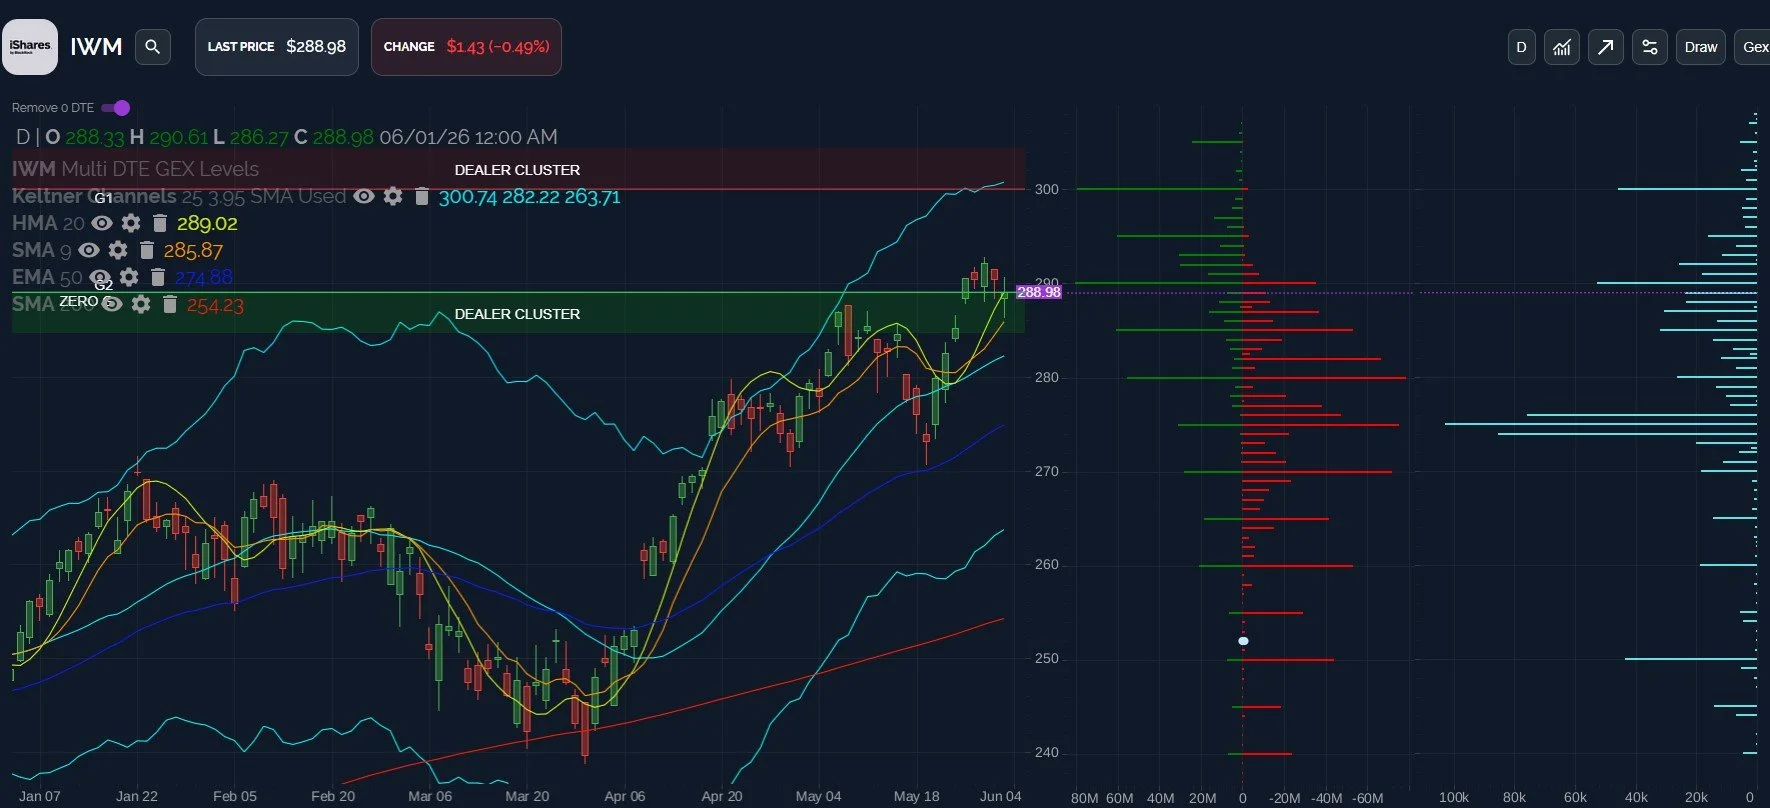
IWM GEX has dropped sharply into negative territory today, just as today’s gap down left IWM stuck just below the HMA. IWM is gripping on with both hands, but the grip is slipping, especially given the close below the big GEX level at 290. We’ve previously mentioned that 290 was an important line-in-the-sand, and today’s close increases the odds of a test of 280-285, in our view. IWM’s chart overall doesn’t look bad, with the Keltners pointing higher and positive GEX remaining at 300, so we also keep IWM on our dip buy list.
Key levels: Bullish to 300 above 290. * Bearish to 280-285 based on today’s close, where we’ll reassess.
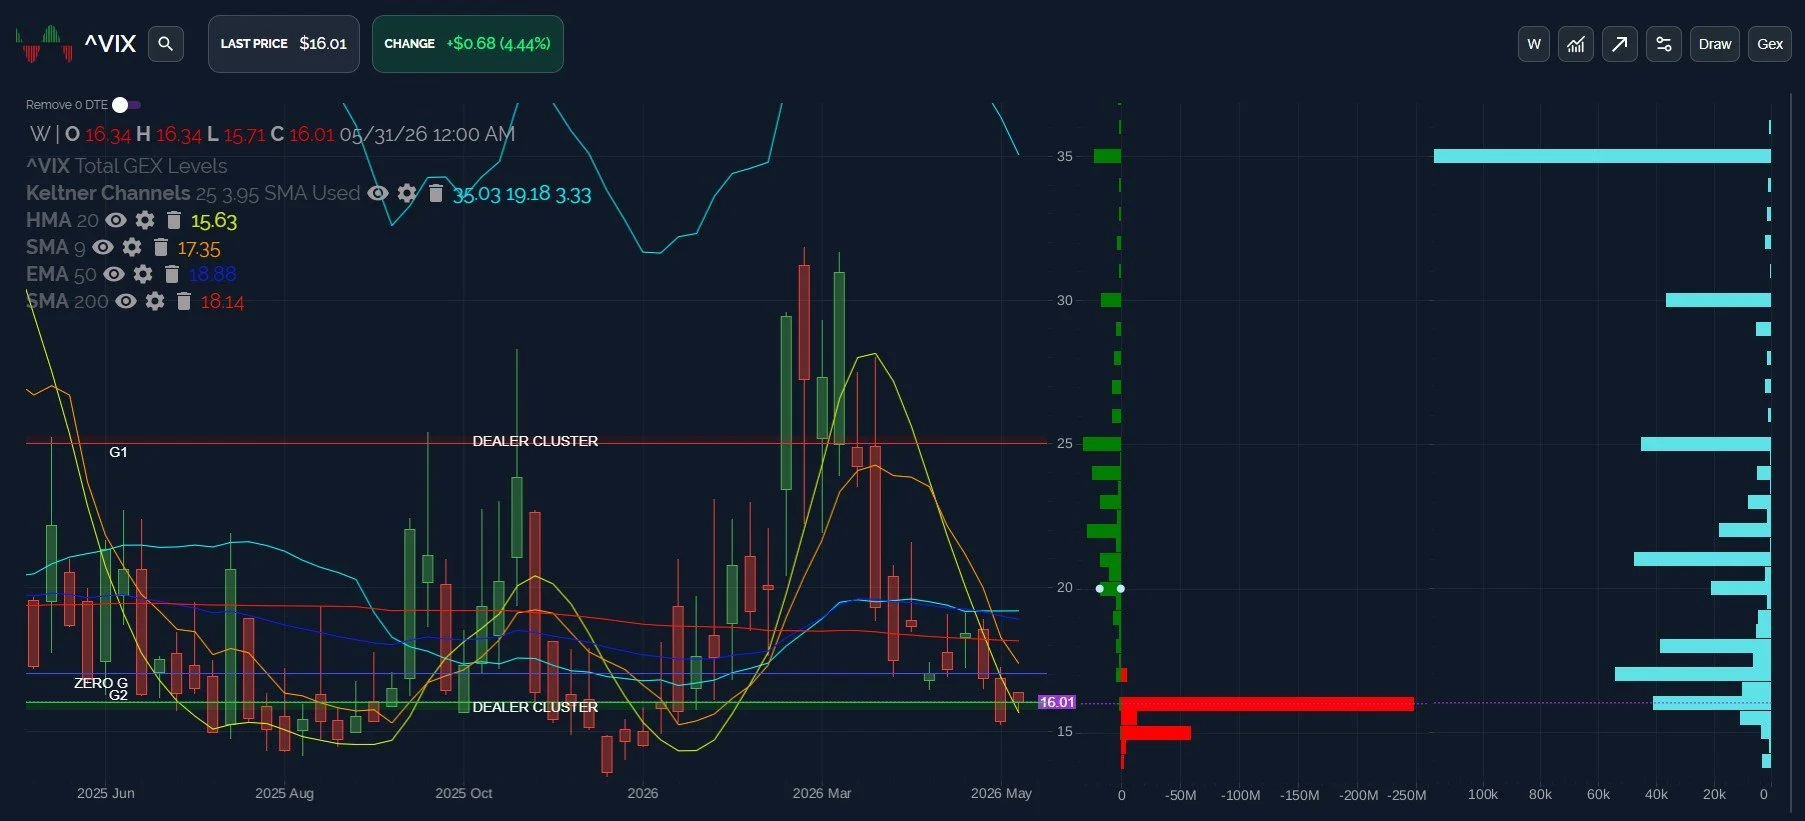
VIX: Back ABove The Weekly HMA
The VIX gapped above the weekly HMA, also closing right at the daily HMA, and GEX as well as volume are mostly spread across higher strikes. Recent weeks saw the attempts to breach the HMA rejected, so closing above the line is a change worth noting, especially with VVIX up 5 and a number of VIX:VVIX divergences in recent days. The chart still looks bearish for volatility, so the burden is on the bears to show a change in trend similar to what we saw in January. Until then, a brief spike is possible, but I see 18-20 as the first area to reassess, with 25 as a more bearish target.
Key levels: Caution for bulls is warranted over VIX 16, with 20 as an initial upside target. * Loss of 15.5 likely means the market isn’t done with this round.
Join The discussion
Tonight’s YouTube video takes a look at SPX, IWM, the VIX, MSFT, and MU, so check it out if you have a few minutes! Prior videos can be viewed by clicking Community at the top of our homepage to find our YouTube channel link.
Non-subscribers can join through Community on our homepage. First-time guests get a free 7-day trial of the premium Discord channels, where we talk through what is happening in real time.
We run a livestream from the homepage every day around 10:30am ET, and you can replay the most recent one any time before the next.
Thanks for being part of our community and know that we invite and appreciate your feedback!
The information provided by Geeks of Finance LLC is for educational purposes only and is not intended to be, nor should be construed as, an offer, recommendation or solicitation to buy or sell any security or instrument or to participate in any transaction or activity. Please view our Investment Adviser Disclaimer and Risk Disclosure.