
SPX 7600: Will Initial Rejection Hold?
Friday saw initial rejection at 7600, which was expected. VIX divergences continue while SMH is not making new highs. Are these signs that we’re edging closer to a drop, or is this just noise in a powerful uptrend?
Members save $300 on the annual Portfolio Manager plan with code MAYFOMO at checkout, which ends June 6 (in case your FOMO extends beyond May).
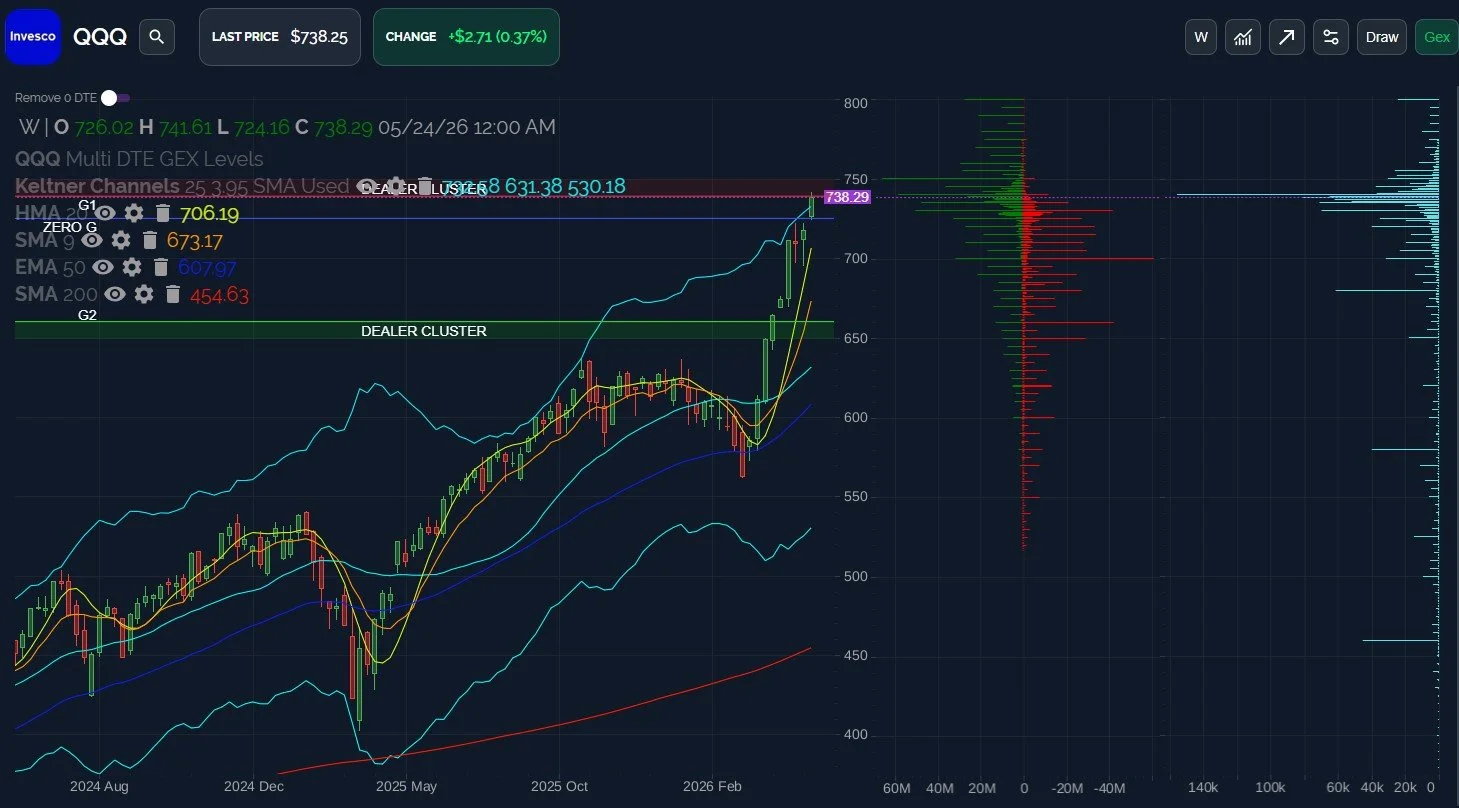
QQQ: Unprecedented Stretch Above The Weekly Keltner
QQQ saw new highs last week as SMH took a backseat to some of the “usual suspects” as AAPL and MSFT showed strength into the end of the week. Positive GEX at 750 certainly increases the odds that QQQ stretches even more beyond the weekly upper Keltner channel, but GEX drops off significantly after 750, and as you’ll notice looking back at your own chart, QQQ rarely exceeds the upper weekly Keltner channel without a subsequent consolidation period. A modest pullback to somewhere between 705-720 is possible if 729 is lost. For now, the trend is higher.
Key levels: 750 "stretch upside” target * Loss of 729 could target 720 or 705
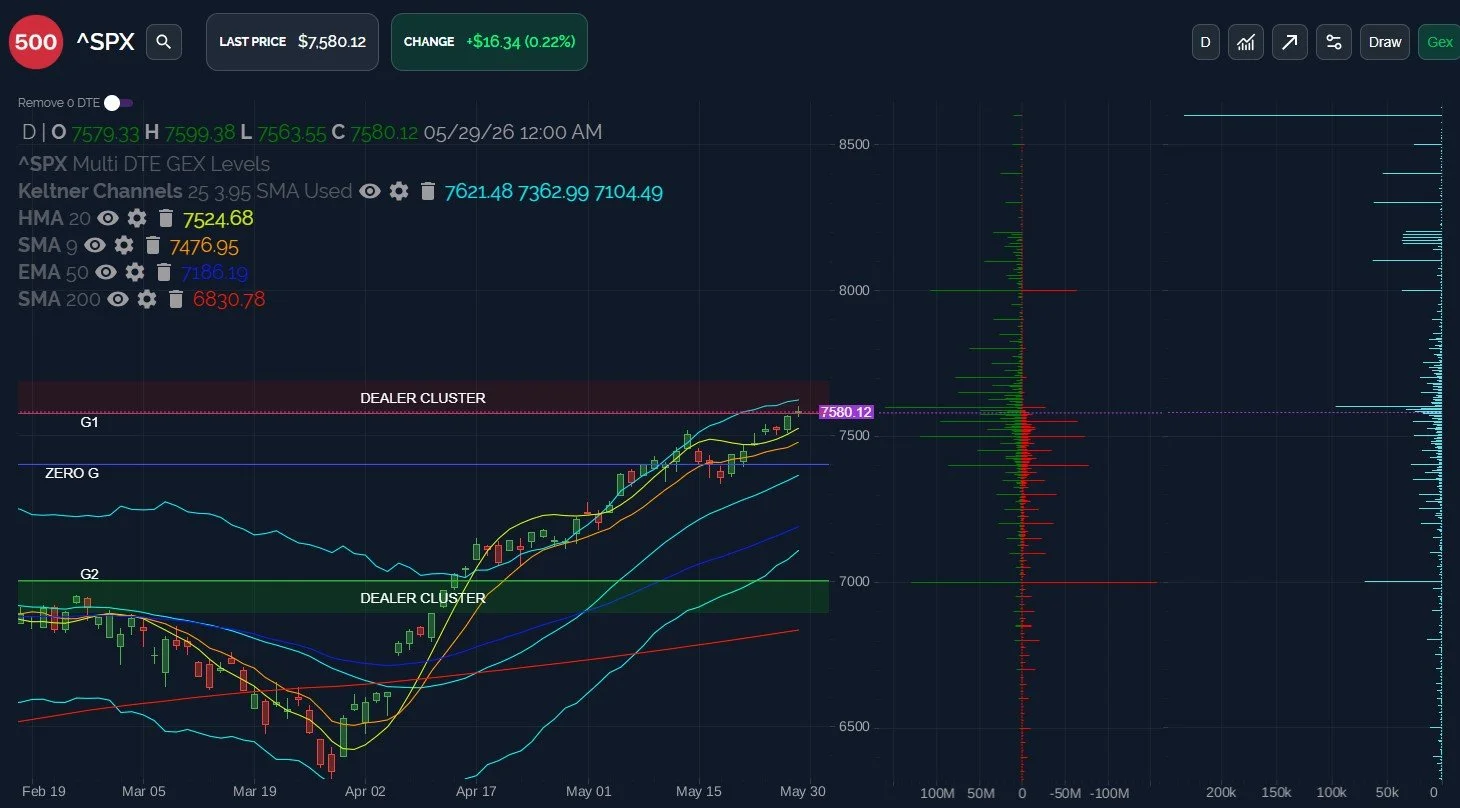
SPX: A Rare 9-Week Streak
SPX just completed 9 weeks in a row of gains, a rare feat. The trend still appears to be higher, with Keltner channels angled higher, GEX growing beyond 8000, and components within the index that appear to be far less overbought than semiconductors. Rotation may favor SPX if SMH begins to underperform. Friday’s rejection at 7600 held into the close, but it’s possible that we see another push this week, though GEX is not as significant above 7600, at least until you get to 8000. All indications point to a move into the 7620s as being possible, though a fade from that area could easily take us back under 7600 and down to the 7400-7500 zone.
Key levels: Bullish above 7524, below 7524 targets 7500 and then 7476 * Extreme positive GEX increases the risk of a countertrend pullback before pushing higher toward 8000
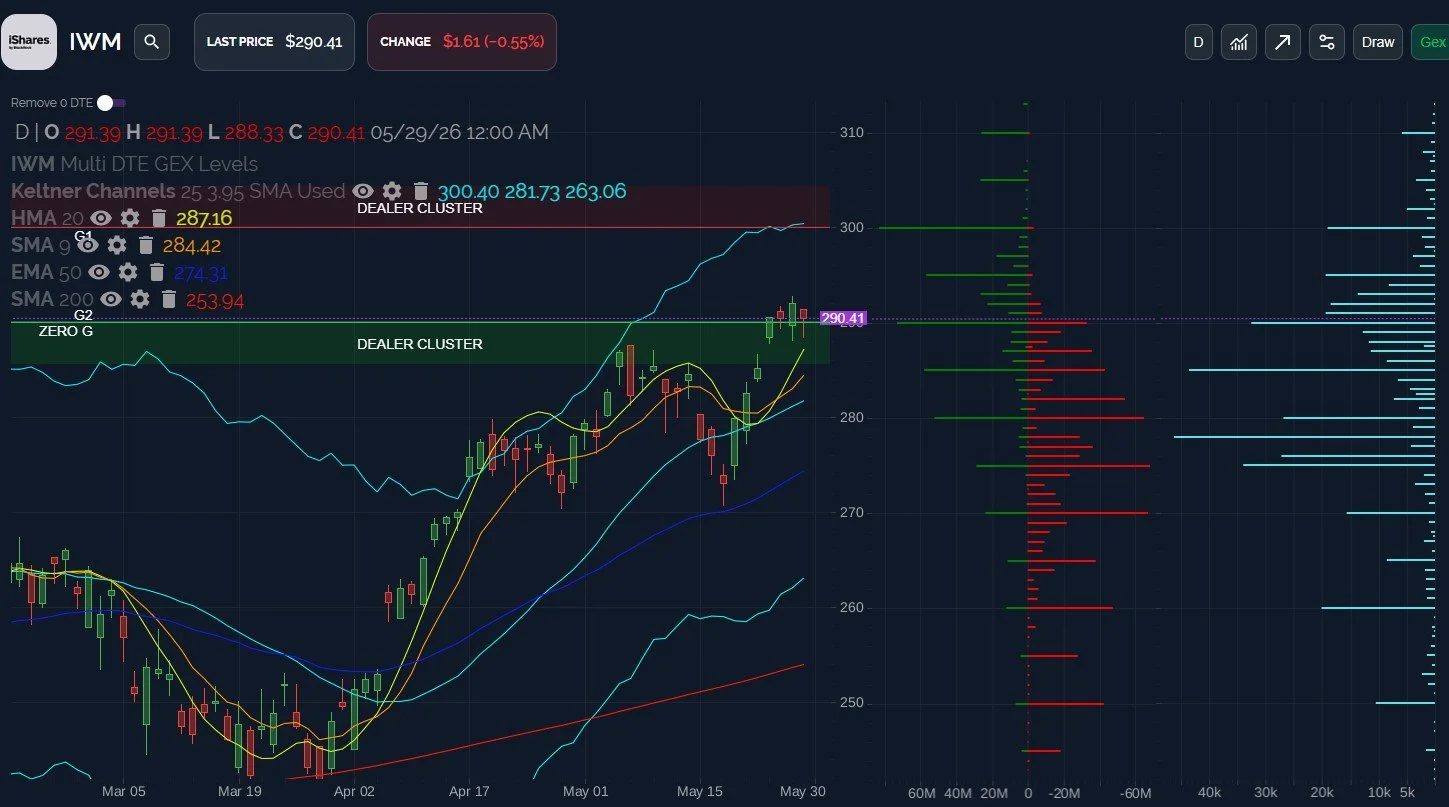
IWM holds bullish potential
IWM has maintained a relatively tight 4-day range moving sideways after a powerful move off the mid-May lows. Holding above 290 raises the risk of a fast move to 295-300 before a meaningful pullback. Volume remains elevated at lower strikes, and GEX is lacking above 300. Losing 287 increases the odds of a pullback to 275-280, where we may initiate a long biased play on IWM.
Key levels: Bullish to 300 above 290, short-term bearish to 275-280 below 287.
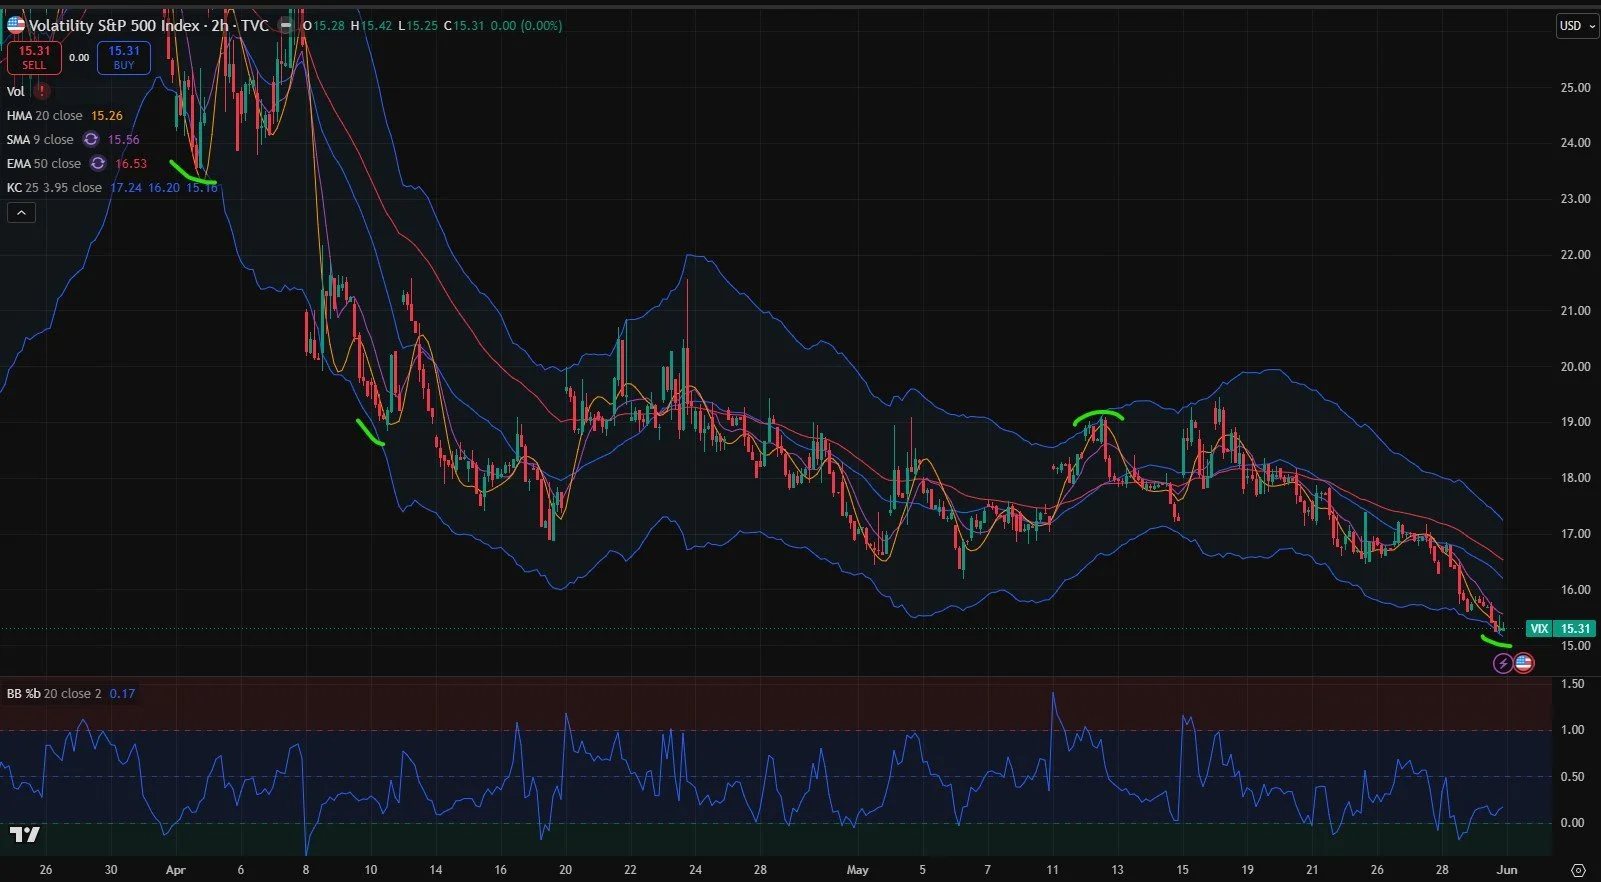
VIX: contrarian long volatility signals building
Last week saw a continuation of negatively correlated VIX:VVIX days occurring, which can be a great indication of an upcoming VIX spike, especially when a cluster of negatively correlated days appear over a short timeframe. We also see the VIX at a spot on the chart where the lower Keltner channel, the VIX level, and the HMA are all very close to each other, all while the %B indicator is just barely off of the 0.0 mark. These conditions are visible twice since April, and a 3rd time if we include the opposite situation at the top Keltner, and all 3 instances saw nearly immediate trend changes.
Key levels: Risk to 20 based on the VIX’s current position relative to key indicators. * VIX 15 appears to be a key bottoming area based on GEX and option activity.
Join The discussion
Tonight’s YouTube video takes a look at SPX, QQQ, the VIX, SMH, NOW, CRM, NOW, and more, so check it out if you have a few minutes! Prior videos can be viewed by clicking Community at the top of our homepage to find our YouTube channel link.
Non-subscribers can join through Community on our homepage. First-time guests get a free 7-day trial of the premium Discord channels, where we talk through what is happening in real time.
We run a livestream from the homepage every day around 10:30am ET, and you can replay the most recent one any time before the next.
Thanks for being part of our community and know that we invite and appreciate your feedback!
The information provided by Geeks of Finance LLC is for educational purposes only and is not intended to be, nor should be construed as, an offer, recommendation or solicitation to buy or sell any security or instrument or to participate in any transaction or activity. Please view our Investment Adviser Disclaimer and Risk Disclosure.