
SPX New High: Done, Or More To Go? May 14 Stock Market Preview
Get $300 off of the annual Portfolio Manager subscription by entering the code MAYFOMO at checkout! This will only last for a limited time!
Tonight’s YouTube video covers SPX, QQQ, the VIX, MSFT, AMD, and APLD, so give it a look if you have a few minutes! You can view our library of previous videos by clicking Community at the top of our homepage to find our YouTube channel link.
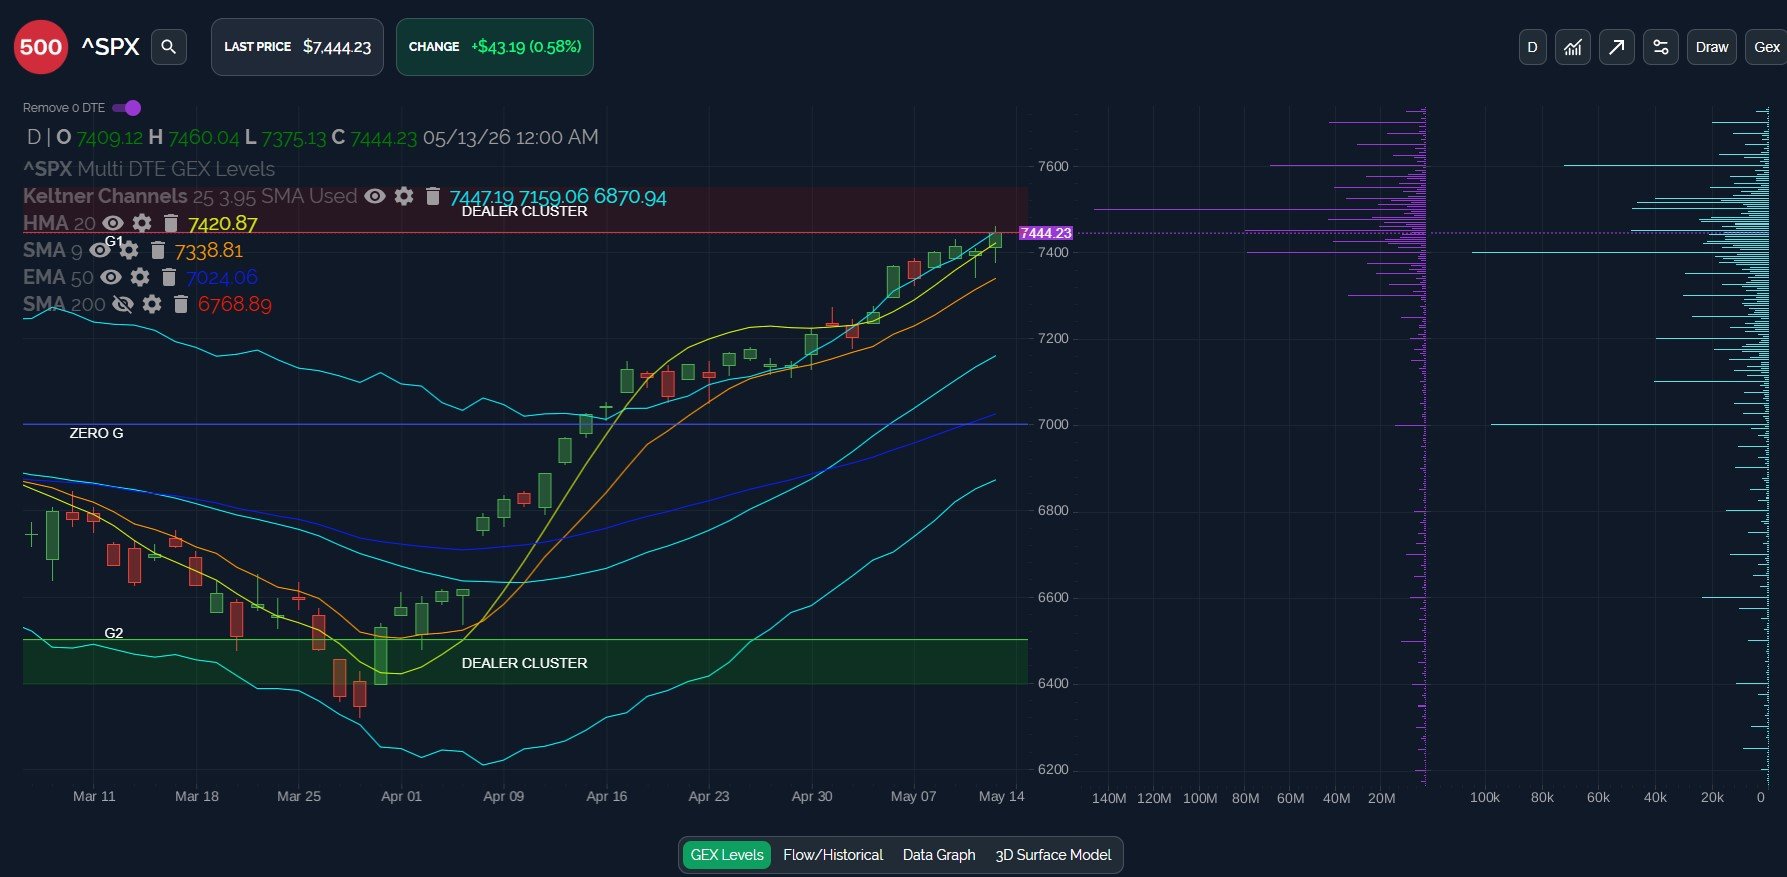
SPX reached the 7450 GEX cluster we’ve discussed a couple of times this week as a prominent potential target.
The trend remains higher, GEX remains largest at positive strikes (on a net basis), and SPX is holding key moving averages as it rides the upper daily Keltner channel.
SPX still hasn’t had a single large down day since March, and we think a pullback could happen soon. SPX is in the upper Dealer Cluster zone as well.
The tactical level at 7420 (the rising HMA) is the first technical line-in-the-sand I’ll be watching, with a daily close below that level potentially signaling a short-term shift in trend.
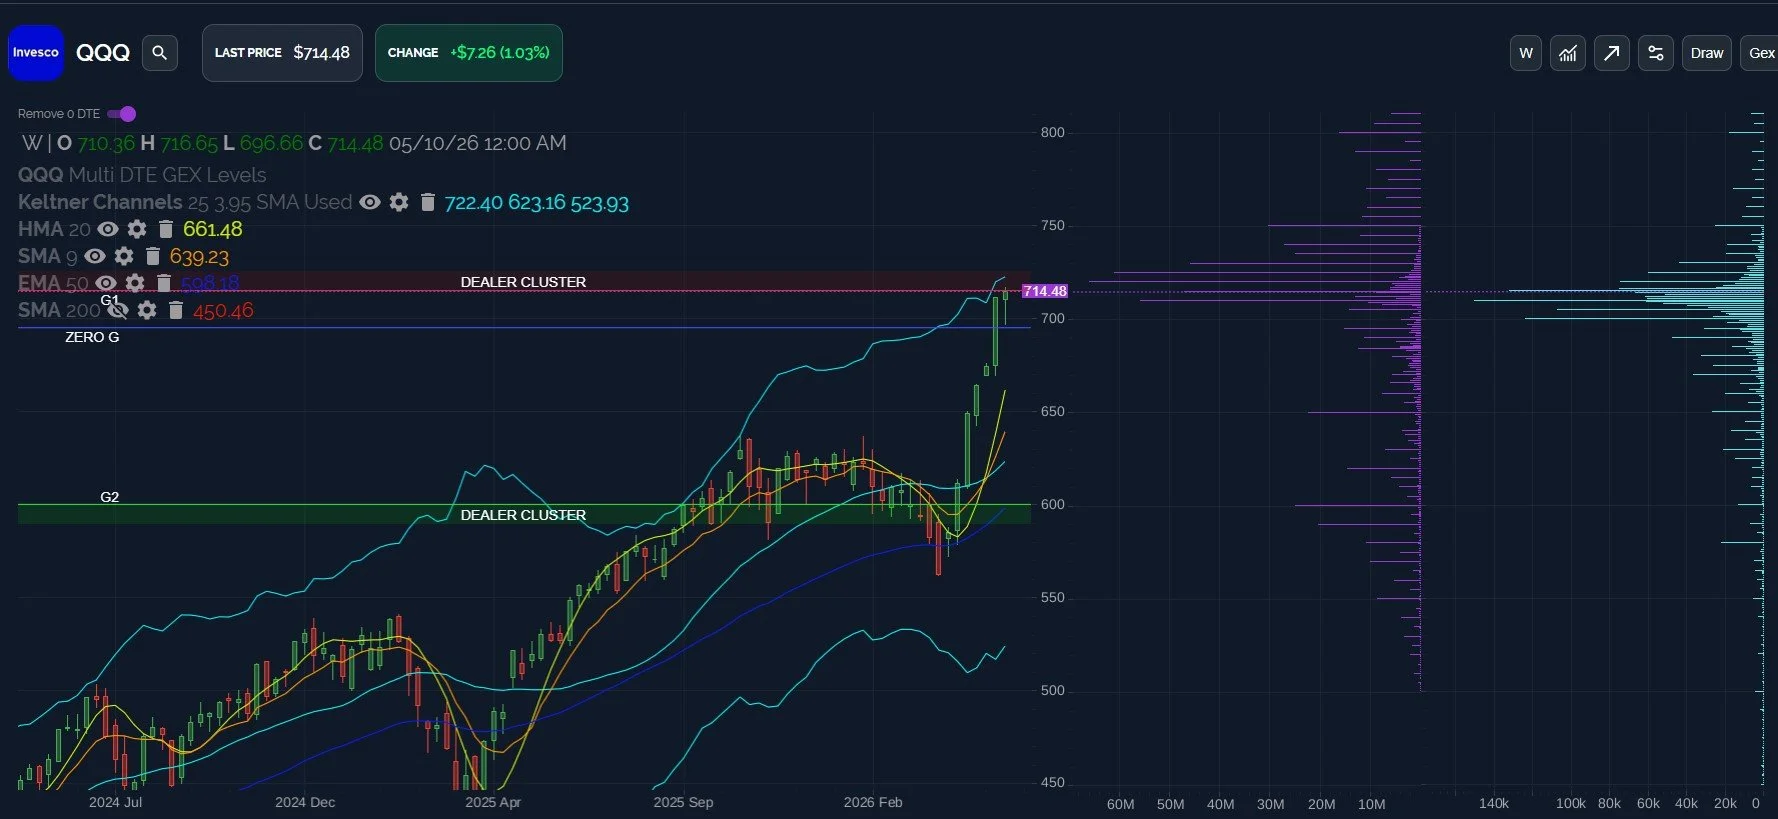
QQQ continues to hang out around the upper weekly Keltner, making a new high today.
QQQ is still significantly stretched above key moving averages on a weekly basis, and the upper Keltner at 722.40 may serve as an important resistance area.
Net GEX expiring Friday is large at the 720 and 725 strikes, so GEX seems to indicate that QQQ still has a chance to meet or exceed the top channel boundary, at least temporarily.
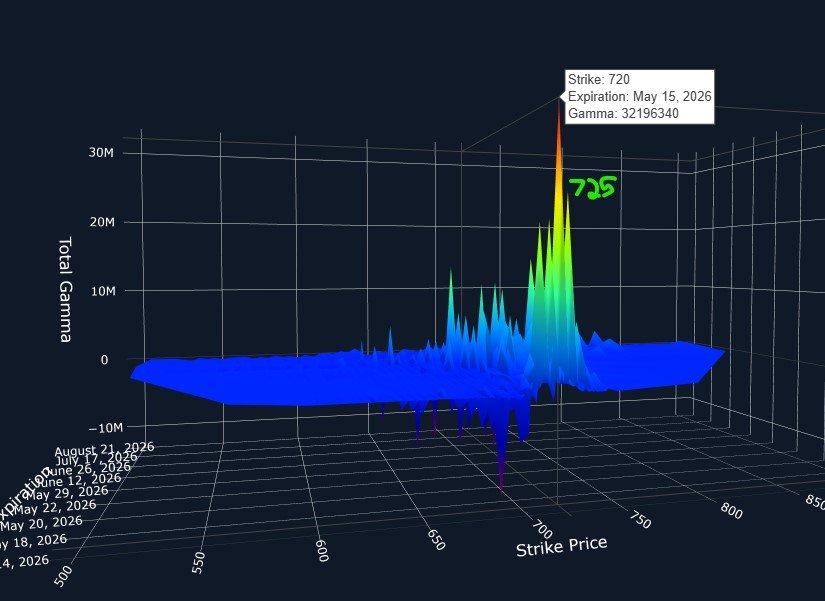
QQQ’s 3D graph brings attention to the large positive GEX that we were just discussing at 720 and 725.
The presence of such clusters doesn’t guarantee that we hit those targets on Friday exactly (or at all), so we could see them reached Thursday or Friday, if those GEX clusters don’t shift dramatically beforehand.
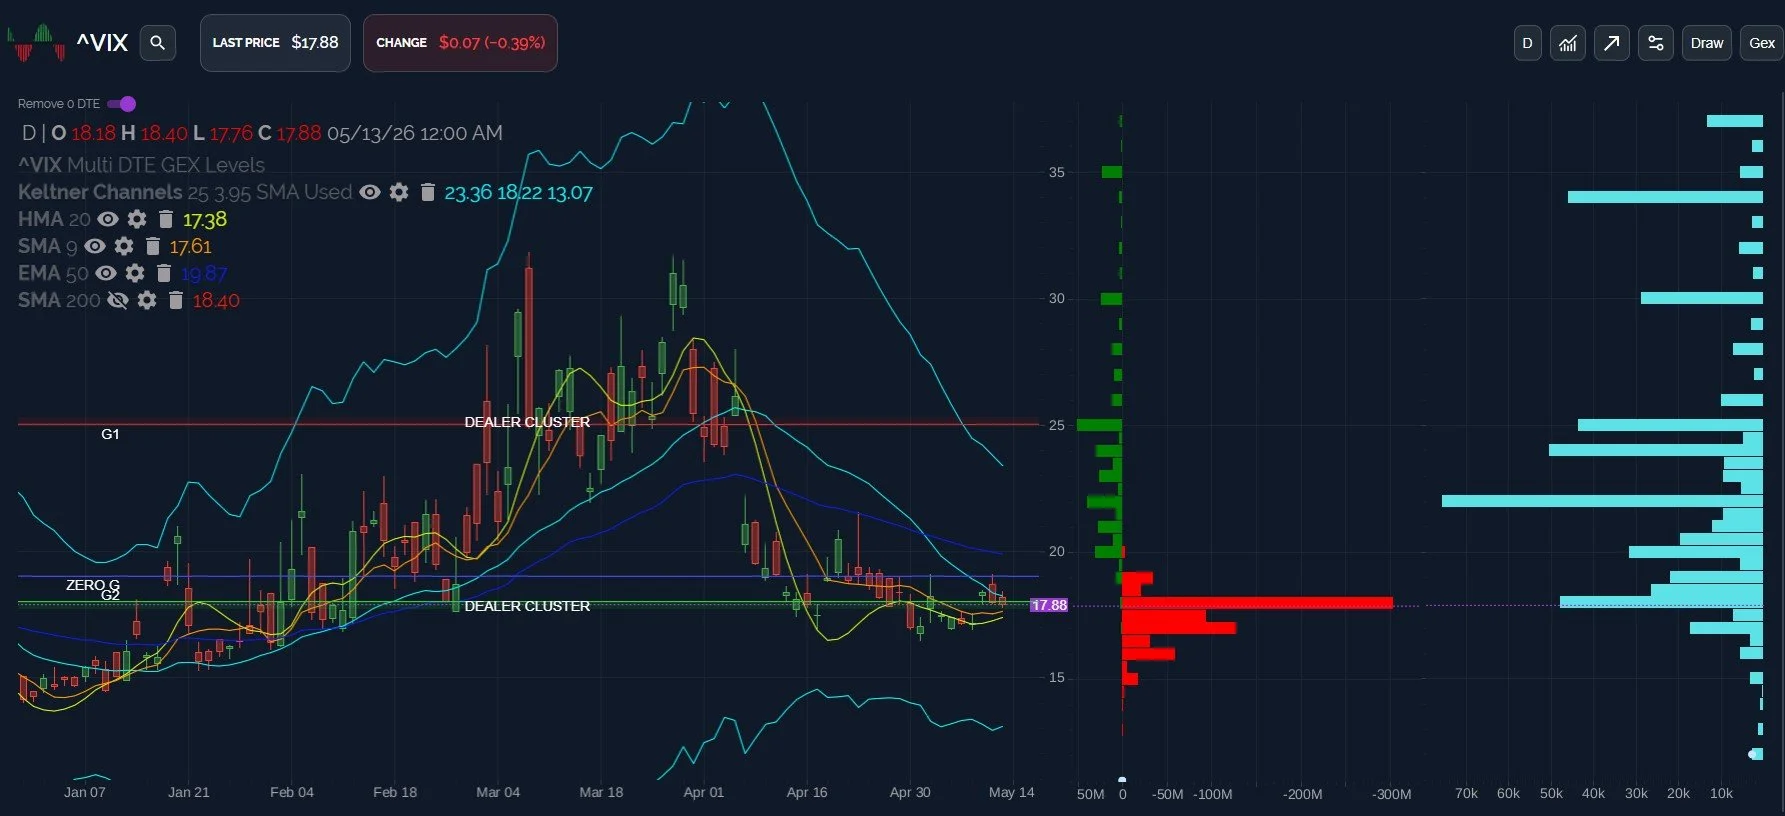
The VIX daily chart shows a recent trend of higher lows for the VIX, and the VIX is above both the HMA and the 9 SMA, so volatility is at risk of spiking.
The weekly chart still shows the HMA declining toward the VIX, so we may see a few more days pass of sideways or slightly downward action for the VIX.
Any near-term spike this week is likely to find resistance at 19-20, and we’ve seen 19 touched this week already.
While semiconductors have driven the rally, other tech stocks (like MSFT, which we discussed in today’s YouTube video) carry the potential to play “catch-up” as the week goes on, potentially providing support for the major indices if semis show any weakness. The process of topping may take some time due to the strength of the move higher and the need for buyers to simply get exhausted before a more meaningful drop. We’ll keep an eye on developments and we’ll share what we’re seeing in Discord.
Thanks for reading, we hope you’ll join us in Discord to continue the discussion!
To enter Discord as a non-subscriber, go to our homepage and click on Community to enter our Discord server! First-time guests receive a free 7-day trial of the premium Discord channels and this is where we discuss what’s happening in real-time.
We conduct a livestream that is accessible from our homepage every day around 10:30am ET, so feel free to join us there. You can also listen to our most recent livestream any time before the next day’s livestream occurs.
Don’t forget, our current promotion MAYFOMO can be entered at checkout for $300 off of the annual PM tier!
Thanks for being part of our community and know that we invite and appreciate your feedback!
The information provided by Geeks of Finance LLC is for educational purposes only and is not intended to be, nor should be construed as, an offer, recommendation or solicitation to buy or sell any security or instrument or to participate in any transaction or activity. Please view our Investment Adviser Disclaimer and Risk Disclosure.