
Threatening The Downtrend Line: April 7 Stock Market Preview
Get $300 off of the annual Portfolio Manager subscription by entering code EASTER26 at checkout! This will only last a few more days.
Tonight’s YouTube video takes a look at today’s developments with SPX, QQQ, IWM, GLD, and AMD, so check it out if you have a few minutes! You can view today’s video and our library of previous videos by clicking Community at the top of our homepage to find our YouTube channel link.
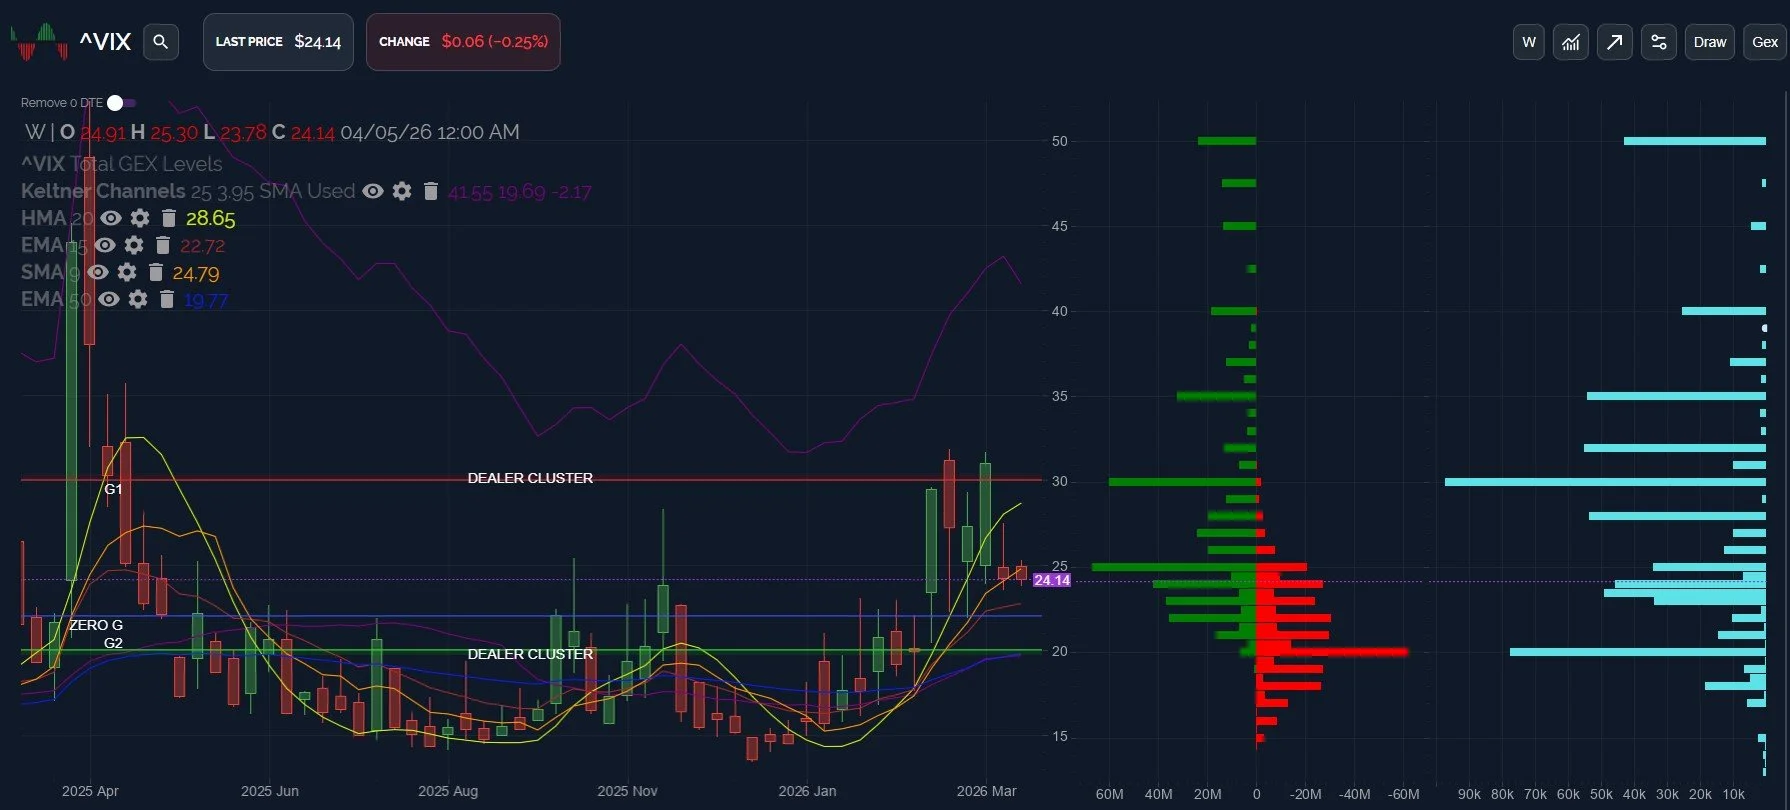
The VIX looks technically encouraging for market bulls at first glance, closing last week below the HMA for the first time since January 4 and starting out the new week slightly below the weekly 9 SMA.
Remaining below 25 raises the odds of a trip to 22 and then 20 in my opinion, but we may have some problems with that scenario unfolding in a straight line.
Potential problem 1: VVIX (the index measuring the expected volatility of the VIX itself) has been making lower highs since March 6. Alright, so far, so good. But VVIX is still higher than it was 3/17, and it’s still where it was April 1st, barely down today to 113.53. Bulls might want to see VVIX sub-100 to signal a potentially calmer environment (amongst several other factors).
Potential problem 2: The VIX still shows positive net GEX, which isn’t very common for the VIX, and volume is almost nonexistent below 20, while most of today’s volume was between 25 and 50.
In summary, while the initial action is encouraging, market dip buyers may want to see the VIX stay firmly below 25, heading to 20. Any move above 25 risks a retest of the HMA near 29-30, where we also see large GEX. Would such a move constitute a buying opportunity in markets? Let’s look at SPX next.
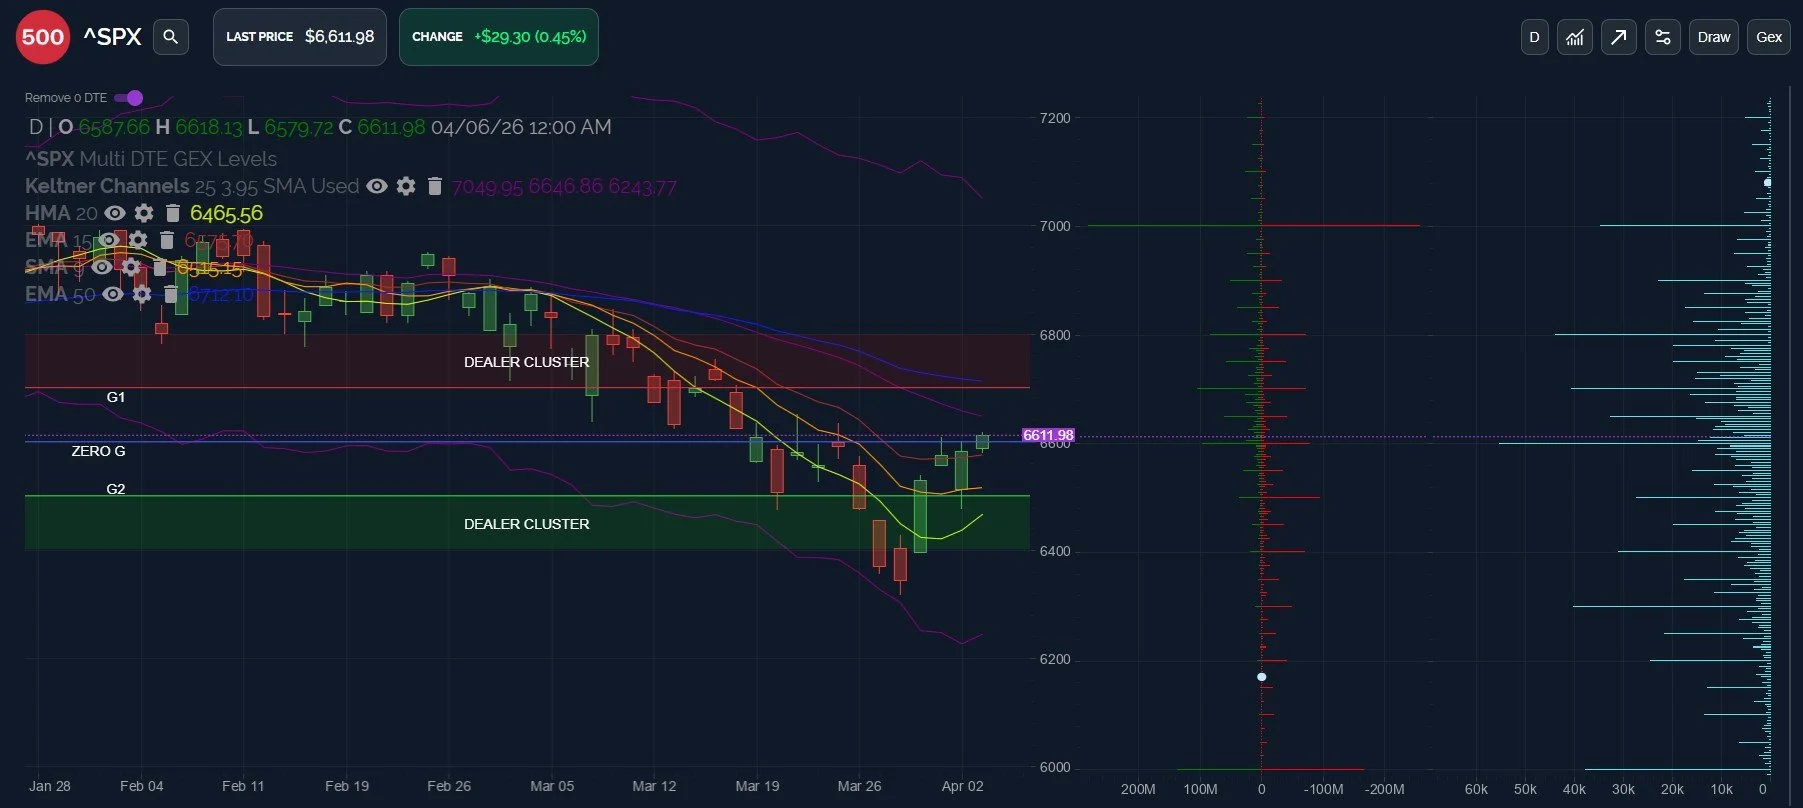
Opposite the VIX, we also see encouraging signs for the market when looking at major US indices, with no major negative divergences to mention. The HMA has turned up, GEX is back in neutral territory (though slightly negative, depending on when you look), and the lower Keltner channel has marginally turned higher, though not convincingly. I’m not as worried about the Keltners turning first, since they will lag in following price action in coming days and weeks.
We have seen GEX flip-flopping from large GEX clusters (on a gross basis) at 6000 to 7000, with the current reading indicating GEX at 7000 is larger on both positive and negative sides. Note that while more GEX rests at 7000 on a gross basis, net GEX at 6000 is larger, which I view as an important difference. We won’t get into the net chart beyond that tonight, but that particular point is worth mentioning.
Looking at the immediate next few days, I’m watching the following levels to the upside: 6673 (weekly 9 SMA) and 6712 (daily 50 EMA).
We’re quite stretched above the daily HMA, so I expect mean reversion to occur, possibly somewhere between 6465-6550, to give a broad range based on similar daily/weekly indicators. A pullback to that general area needs to hold and reverse higher to maintain the bullish picture, in my opinion.
Excluding 0 DTE volume on the chart below, we see option volume was slightly tilted toward the upside in terms of the single strikes with the largest volume, with 6600-7000 seeing a lot of activity. Negative strikes saw noteworthy volume all the way down to 6000, a larger overall range. Nothing decisive in my view, but the dispersion does give me pause regarding the longevity of any continuation higher.
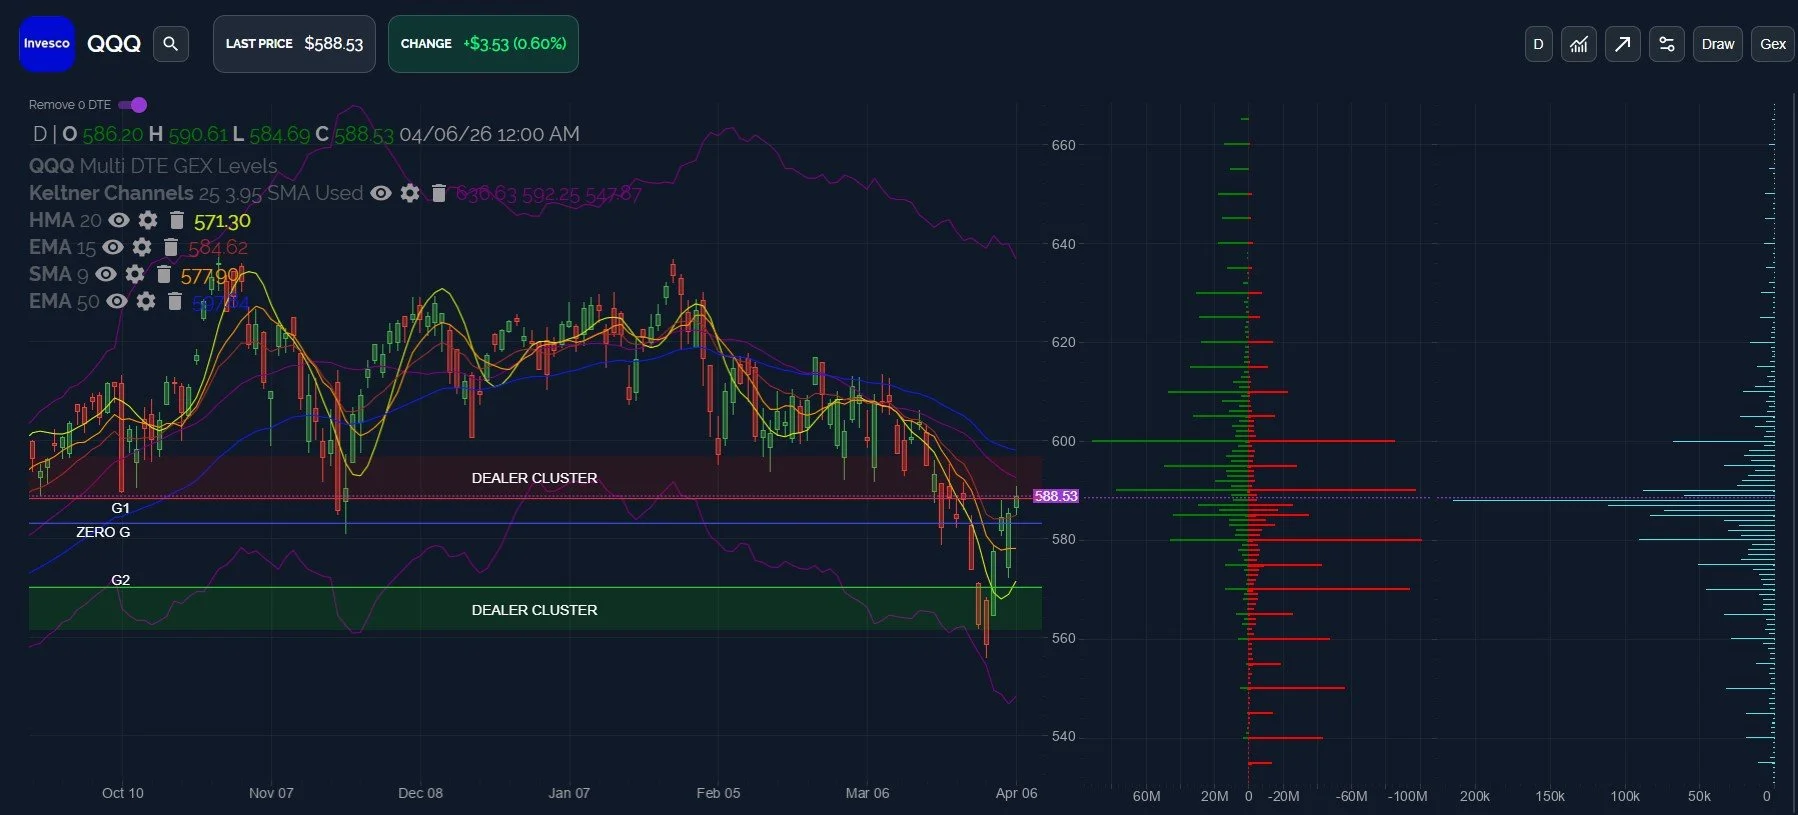
QQQ has a similar look to SPX, though QQQ is just now contending with its downtrend line going back to January, with 590-600 appearing to be very important technically as well as in terms of GEX.
I excluded 0 DTE GEX and 0 DTE volume on the chart below, emphasizing activity geared toward expirations beyond today, showing clearly that QQQ volume is still very minimal above 600, with a lot more volume visible from 540-590.
One other point of potential concern is QQQ’s greater stretch above the HMA, roughly 3% over the line. Mean reversion between two points can always occur in a variety of ways (QQQ’s price moving sideways or down, or the HMA rising as QQQ falls, in this example), but given the 4-day stretch of green candles, I wouldn’t be surprised if QQQ drops back toward the 575-580 area for a retest and the next decision point.
IWM’s weekly chart looks fairly constructive to me, particularly based on the 50 EMA and the Keltner channels, still generally pointing higher.
The HMA and 9 SMA are concerning in that they’re still pointing lower, and we see the light blue bars to the right indicating a lot of activity at the 239 and 240 strikes, not necessarily what bulls want to see.
If we look lower, we see the HMA at 248.59 on the weekly chart, the lower dealer cluster zone at 240-245, and the 50 EMA at 241.
GEX at 260 is prominent despite the volume pointing lower, so maybe we get a spike before a drop, or a dip to buy before a move to 260? My focus is on reacting to whichever occurs first as opposed to predicting which side is reached first.
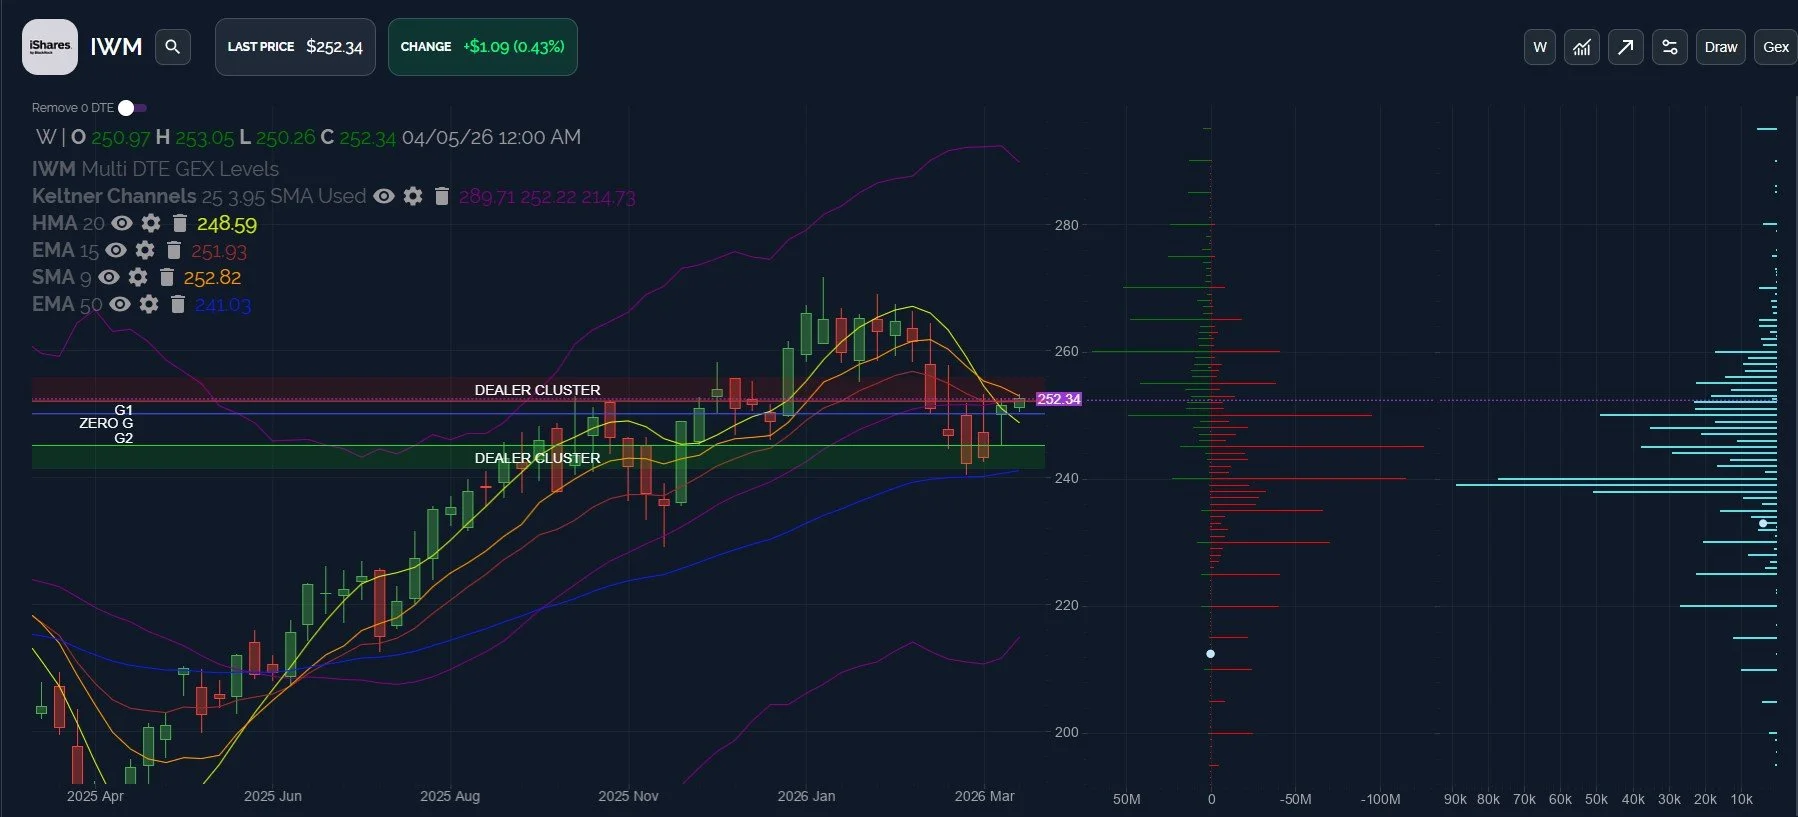
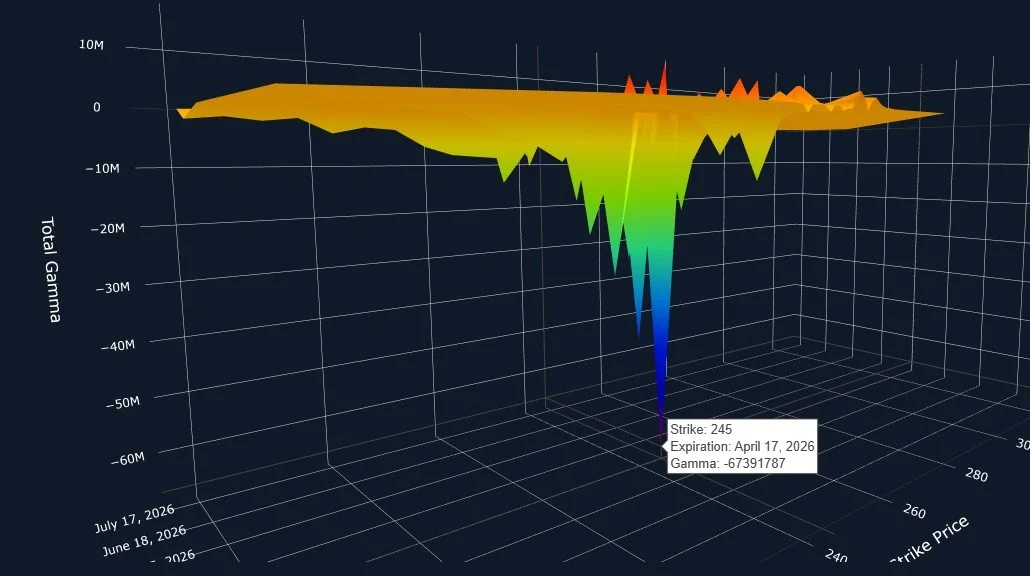
I looked more closely at the 3D graph for IWM and we see large negative GEX clusters expiring OpEx Friday (4/17) at 240 and 245, and some lower strikes down to 230, all of which are larger than any positive strike expiring the same date.
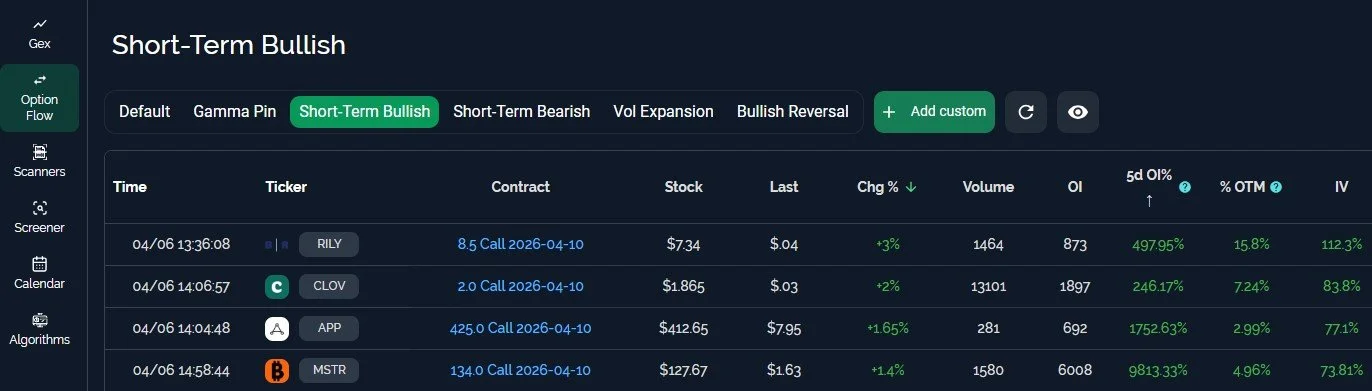
In closing, I’ll share a few option contracts that popped up today on one of our default screeners displaying short-term bullish activity, which may warrant more research. These contracts coincidentally expire this Friday, and I typically look at the gap between the strike price and the current price, and the change in open interest.
This tool allows you to create your own option flow screener or check any of our default choices as seen below, giving a quick view of possible ideas.
We appreciate your involvement and we look forward to seeing you in our Discord community, where we share and converse every day during trading hours.
To enter Discord as a non-subscriber, go to our homepage and click on Community to enter our Discord server! First-time guests receive a free 7-day trial of the premium Discord channels and this is where we discuss what’s happening in real-time. Thanks for reading!
We conduct a livestream that is accessible from our homepage every day around 10:30am ET, so feel free to join us there. You can also listen to our most recent livestream any time before the next day’s livestream occurs.
Get a big $300 discount for the annual Portfolio Manager subscription by entering EASTER26 at checkout!
Thanks for being part of our community and know that we invite and appreciate your feedback!
The information provided by Geeks of Finance LLC is for educational purposes only and is not intended to be, nor should be construed as, an offer, recommendation or solicitation to buy or sell any security or instrument or to participate in any transaction or activity. Please view our Investment Adviser Disclaimer and Risk Disclosure.