
VIX Drop: Bullish For SPX? April 6 Stock Market Preview
Get $300 off of the annual Portfolio Manager subscription by entering code EASTER26 at checkout! This won’t last much longer.
Given the holiday Friday, there’s no YouTube video tonight, but we’ll resume Sunday. You can view the our library of YouTube videos by clicking Community at the top of our homepage to find our YouTube channel link.
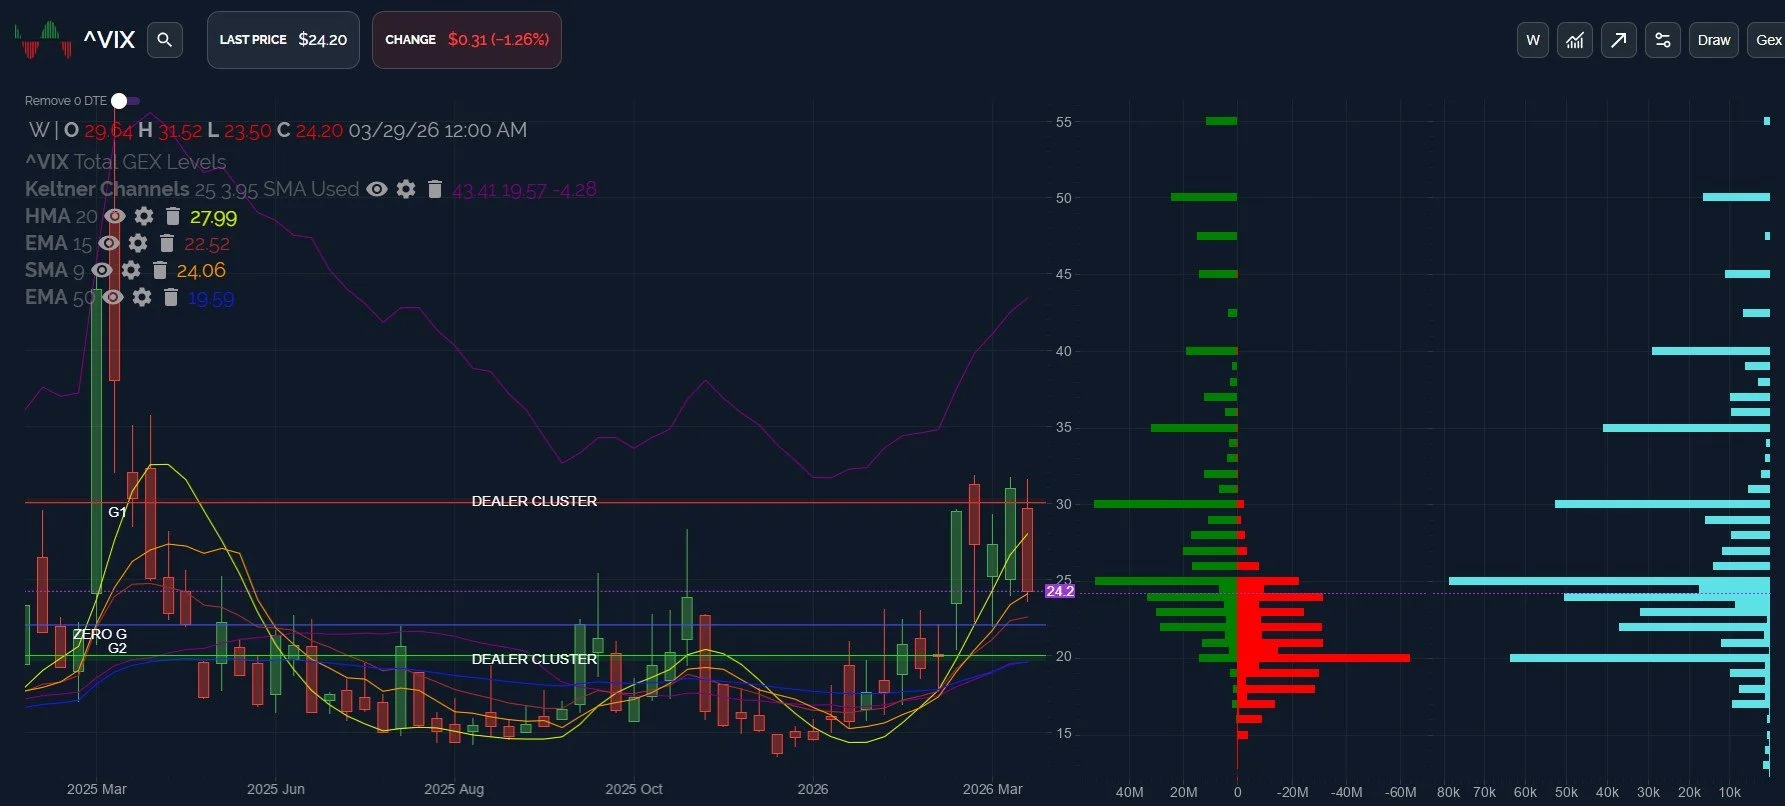
The VIX has been above the weekly 9-period SMA and the HMA since the week ending January 4. That streak ended today, with the VIX closing just above the 9-SMA, well below the HMA.
While a close solidly below the 9-SMA (say, maybe VIX 23 or lower?) might have sealed the deal, we’re instead left with a picture that is encouraging for bulls while also potentially enticing bears, since we’re holding above the 9-SMA and also above the weekly trendline going back to December.
This uncertainty leads me to watch for the following:
A VIX bounce next week that rejects at the HMA (roughly VIX 28) may be another sign that bulls are slowly gaining control. Closing above that area may represent continuation higher for the VIX.
A daily close below the VIX 22 area risks invalidating the trendline, presumably giving the bulls room to rally as the VIX heads toward a test of 20.
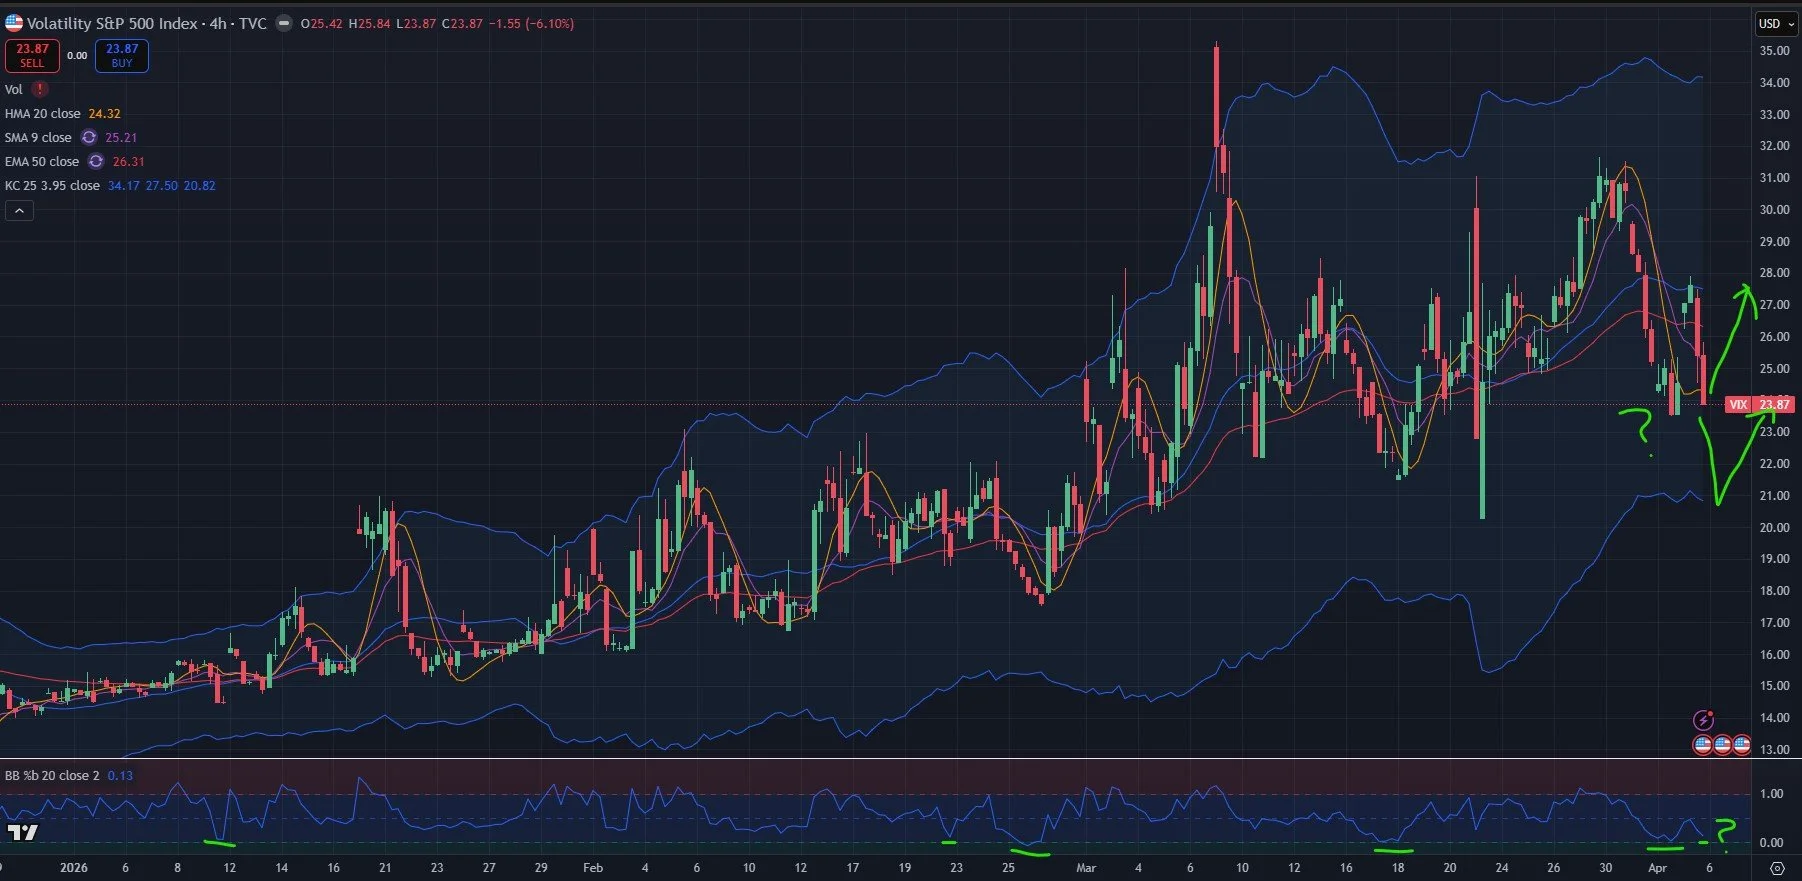
The 4-hour chart presents what I’ll call a “problem” for bulls: You can see we’re testing the trendline for the VIX.
Accompanying this, we see the %B (20,2) indicator already approaching 0.0 again. I underlined the last 5 times we were at 0.0 or near 0.0, and it didn’t end well for market bulls those times. S
ure, this time can always be different, and it’s worth noting that a reading at or below 0.0 can persist for hours or days, but the implication is that the market might still be on borrowed time, if the past holds any weight in terms of the indicator.
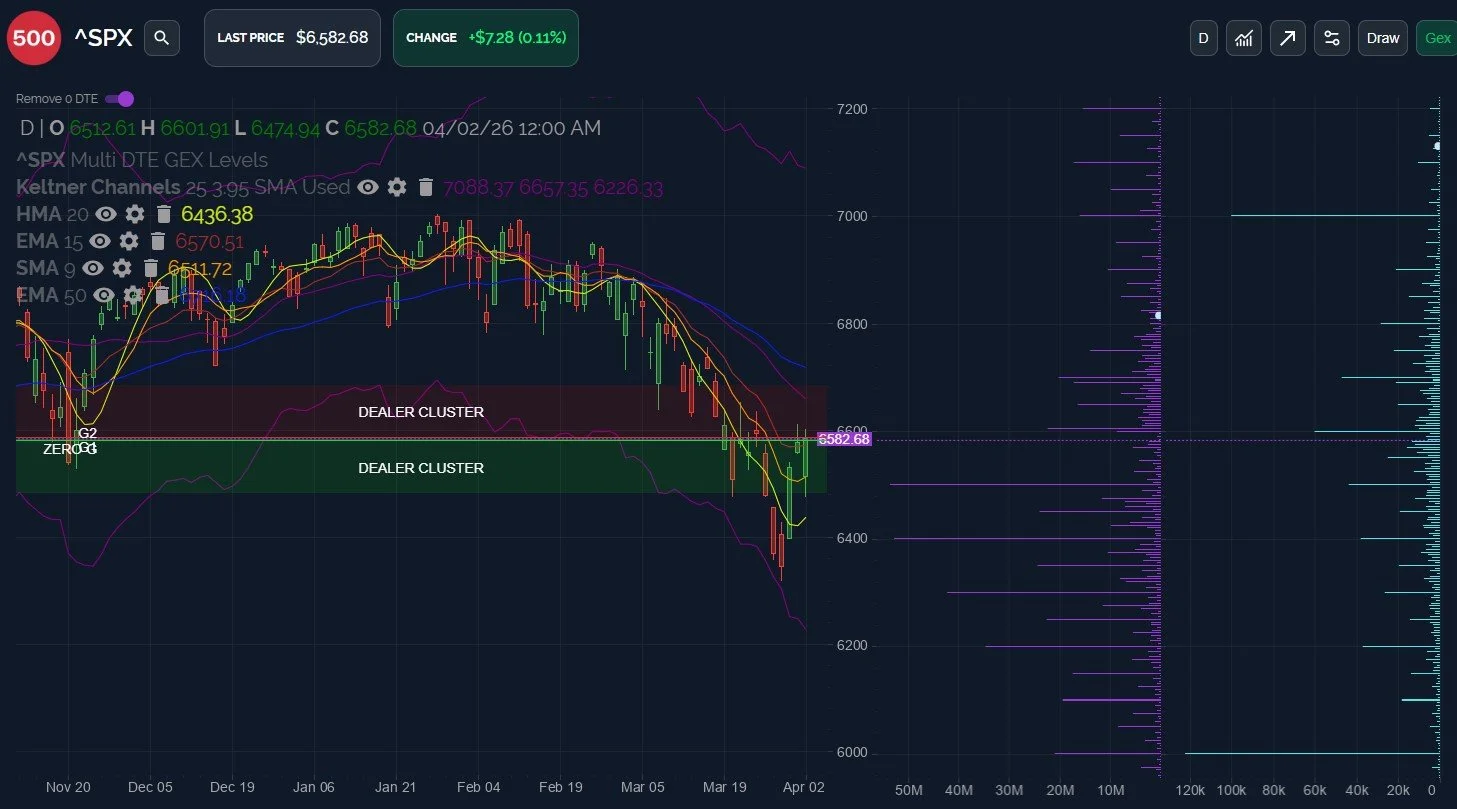
I excluded 0 DTE GEX and volume from the chart below to illustrate where the options market was focused looking beyond today.
We see SPX Keltners still pointing lower, though SPX price is poking just above the steep downtrend line established in late February-early March. Price action has been bullish despite the volatility.
Can it last? I also like that the HMA is curling upward, but with price this far extended above the yellow line, odds favor mean reversion, which would be 146-point drop if the resolution happened quickly, in theory. We may push higher, but regardless, eventually a sideways or down move would be required for mean reversion to occur.
We still see GEX mostly at lower strikes, and any move below 6400 risks a sharper drop to new lows targeting 6200-6300.
QQQ’s HMA is also in the early stages of turning up as the price action begins to drag it higher, but we have the same problem of price being extended far above the line, and GEX is also mostly at lower strikes.
The bullish scenario on a pullback would involve 570 holding on a daily close, in my opinion.
Downside risk to 550-560 exists below 570.
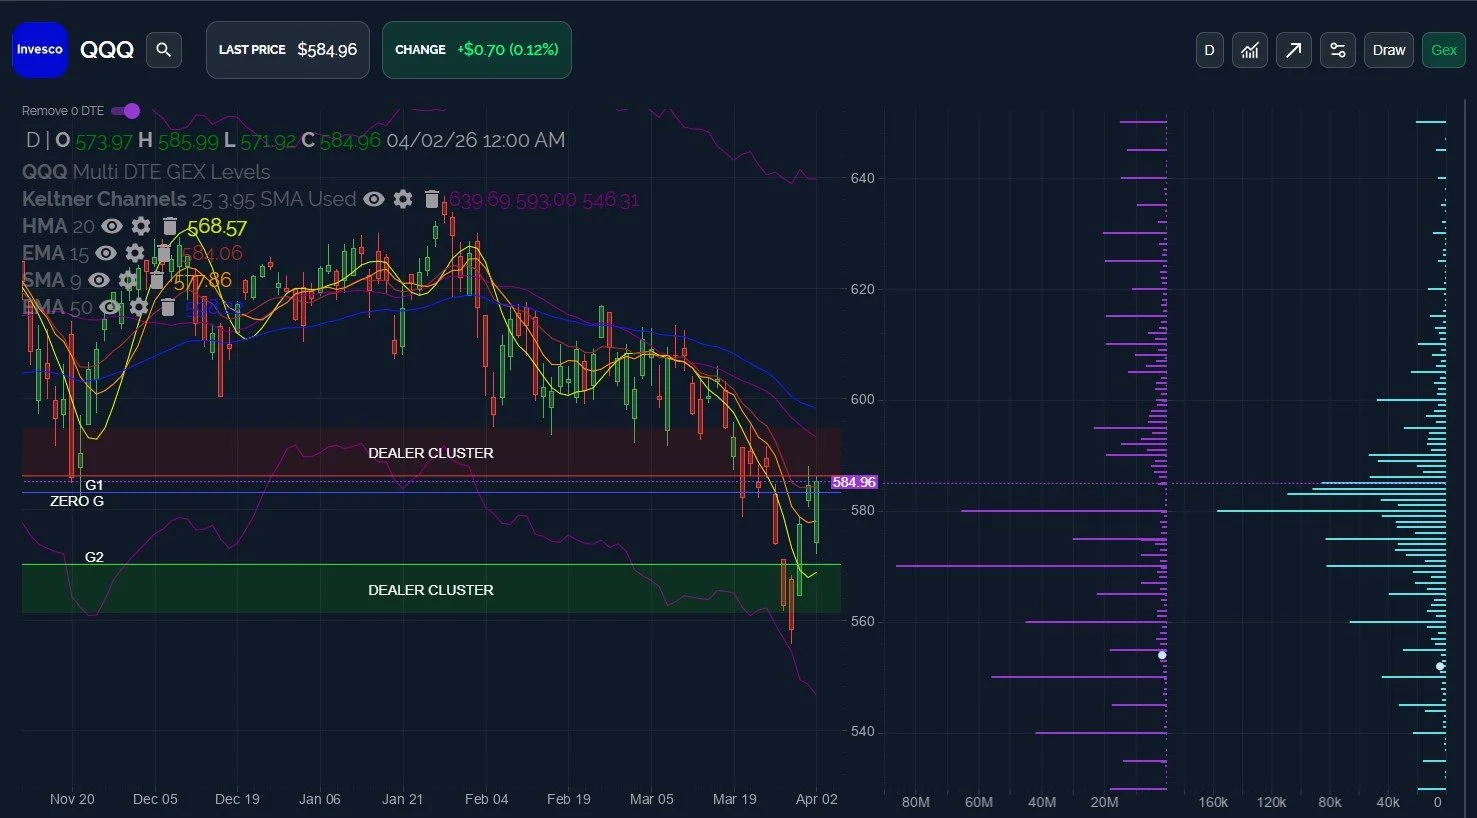
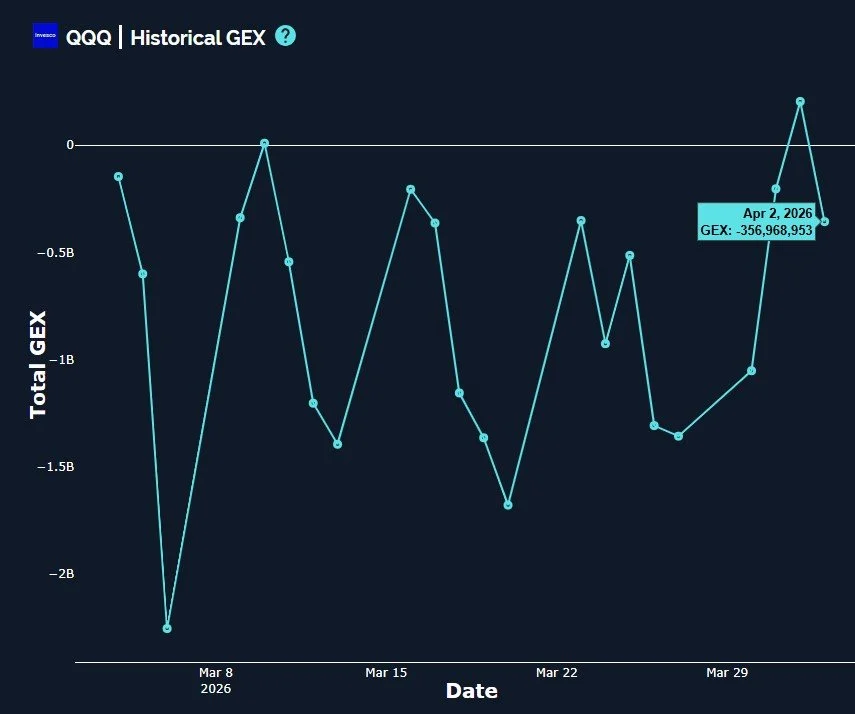
A theme we saw at today’s close is a modest drop in net GEX, but not significant relative to where we’ve seen GEX over the past 30 days.
Net GEX is negative though, so we may still see elevated volatility in coming days.
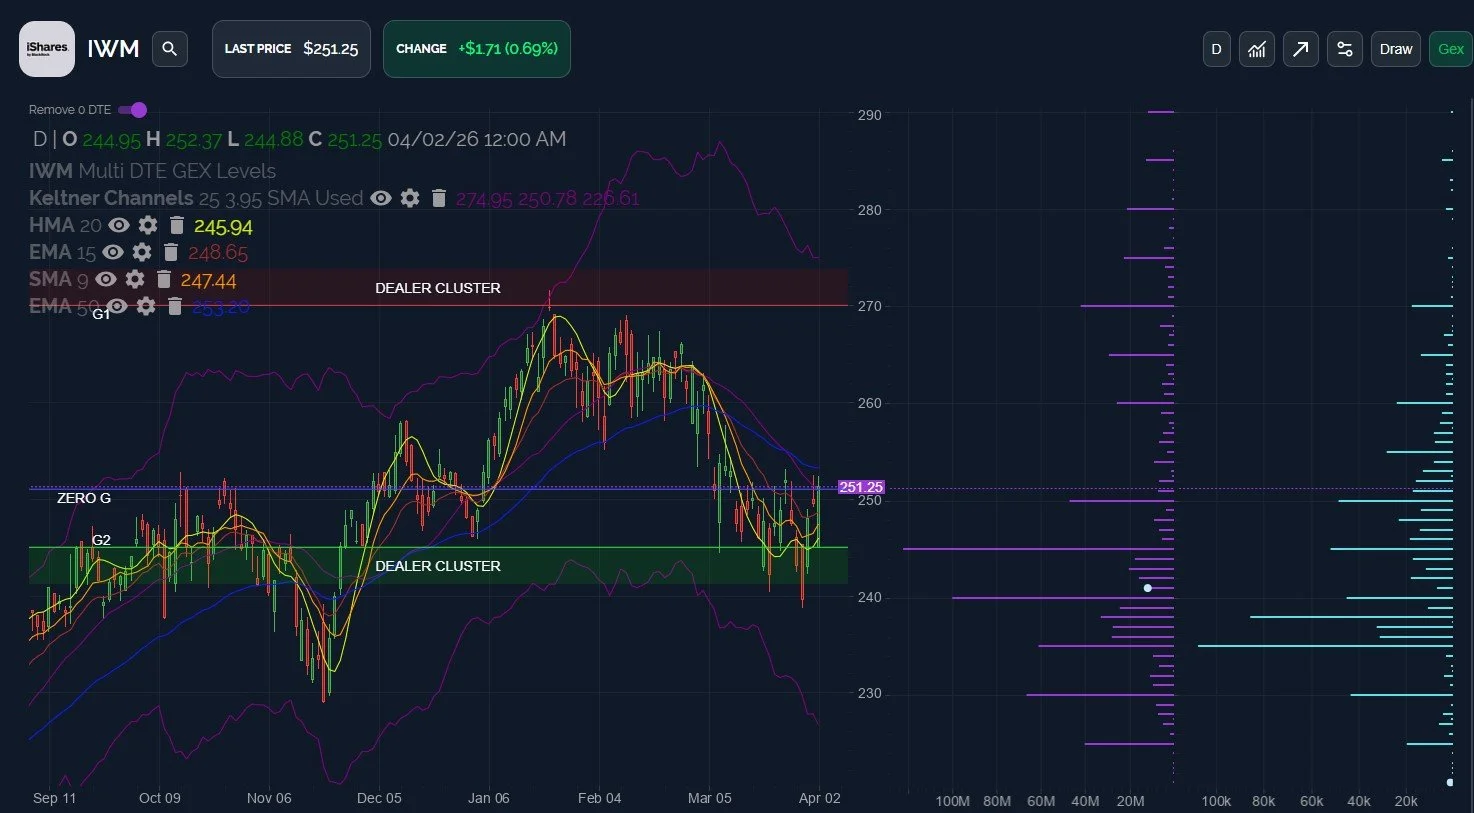
IWM showed outperformance, and in fact, the MAs shifted higher days earlier than SPX and QQQ. I would normally say this is a good omen, though we still see a negative tilt to the Keltner channels.
240-245 appears to be an important zone, and so far, action leads me to view the odds of holding that zone favorably. Losing 240 may see 230, and it’s not the best sign that we see elevated volume at 230-235 for days.
We had a good week and we appreciate your involvement. We hope you’ll join us in Discord this weekend and next week for discussion around the latest shifts in data that we’re seeing.
To enter Discord as a non-subscriber, go to our homepage and click on Community to enter our Discord server! First-time guests receive a free 7-day trial of the premium Discord channels and this is where we discuss what’s happening in real-time. Thanks for reading!
We conduct a livestream that is accessible from our homepage every day around 10:30am ET, so feel free to join us there. You can also listen to our most recent livestream any time before the next day’s livestream occurs.
Get a big $300 discount for the annual Portfolio Manager subscription by entering EASTER26 at checkout!
Thanks for being part of our community and know that we invite and appreciate your feedback!
The information provided by Geeks of Finance LLC is for educational purposes only and is not intended to be, nor should be construed as, an offer, recommendation or solicitation to buy or sell any security or instrument or to participate in any transaction or activity. Please view our Investment Adviser Disclaimer and Risk Disclosure.