
SPX: Pushing On A String? April 21 Stock Market Preview
Get $300 off of the annual Portfolio Manager subscription by entering the code TAXES2026 at checkout! This will only last a few more days.
Tonight’s YouTube video takes a look at SPX, the VIX, PLTR, MSFT, and AAPL, so check it out if you have a few extra minutes! You can view the video as well as our library of previous videos by clicking Community at the top of our homepage to find our YouTube channel link.
I’ve been watching IWM for a slight advanced warning of a deeper pullback, which isn’t a requirement, but IWM has “tipped” us off in the past ahead of some key pivots at times. DIA and IWM were positive though, despite SPX and QQQ slightly pulling back and the VIX gapping up almost to 20 at one point today.
I remain open to a number of pathways forward, but my #1 preference at the moment is for an upward move to a slightly higher high tomorrow or Wednesday, then down modestly, then a high near the beginning of May. Then perhaps a sharper drop that may or may not make a higher low. Let’s look at why:
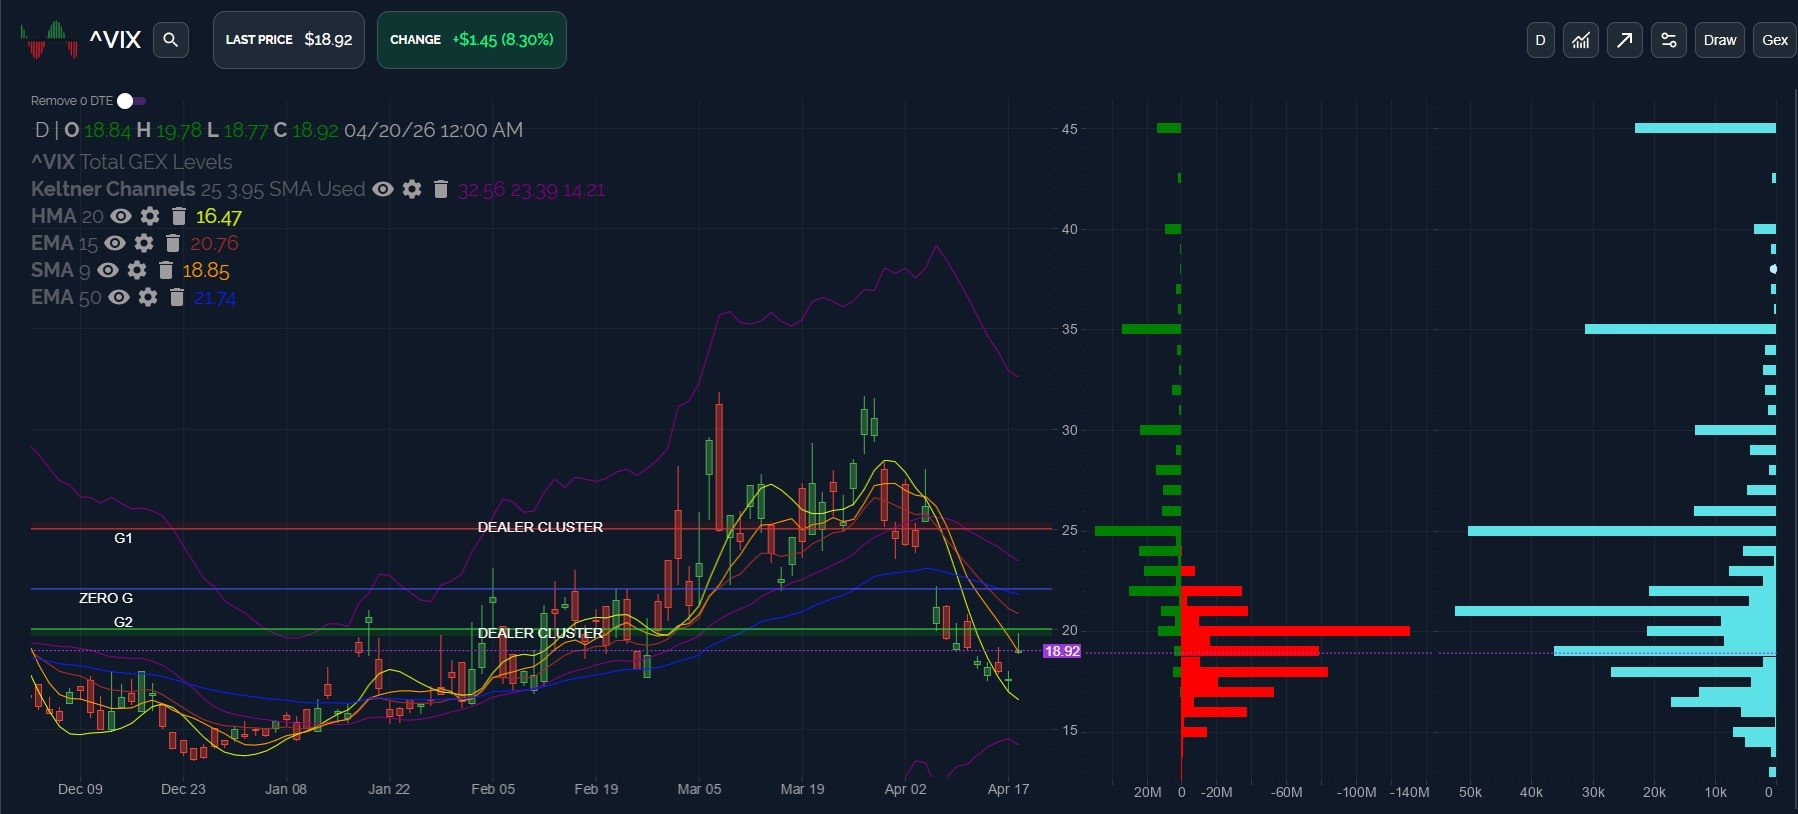
The VIX is now just above the 9 SMA, but both the 9 SMA and the HMA are still declining, introducing the risk of an immediate push lower from this resistance point back to the 17-18 range.
Continuation higher may reach 22 or 25, either of which may be reversal areas from a lower high for the VIX, allowing the market to push higher, presumably.
Volume is still mostly at higher strikes, especially the 21 and 25 strike today.
The 2-hour chart goes along with the idea that the VIX being above the HMA is bullish for volatility, but the distance between the VIX and the HMA may mean another drop for the VIX before we see the VIX work its way higher. The 2-hour chart shows the VIX below the HMA and near the top Keltner channel.
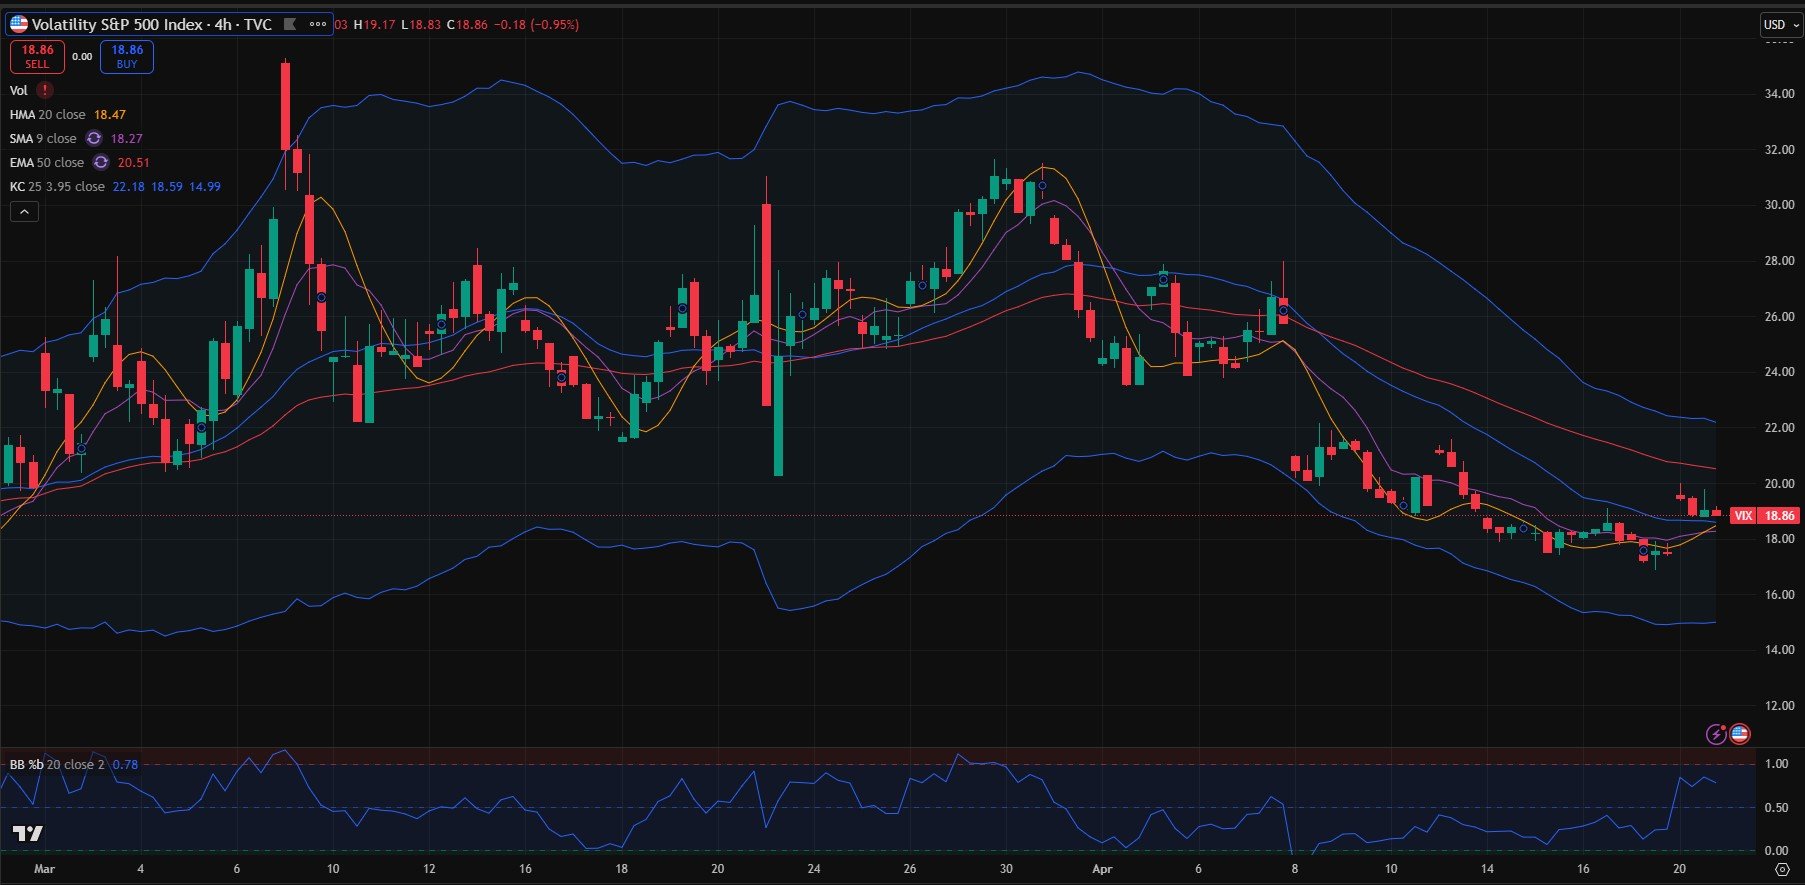
Looking at the 4-hour chart, the VIX leans slightly more positive in my view, but with a likely top near 22, going along with our previous point regarding the GEX picture.
We also see the %B (20,2) indicator almost hitting 1.00 and hugging the top line. I don’t like seeing this metric approach what I consider overbought conditions so quickly, which is why I think any trip to 22 likely sees another VIX crush, even if we don’t reach the sub-17 lows recently seen.
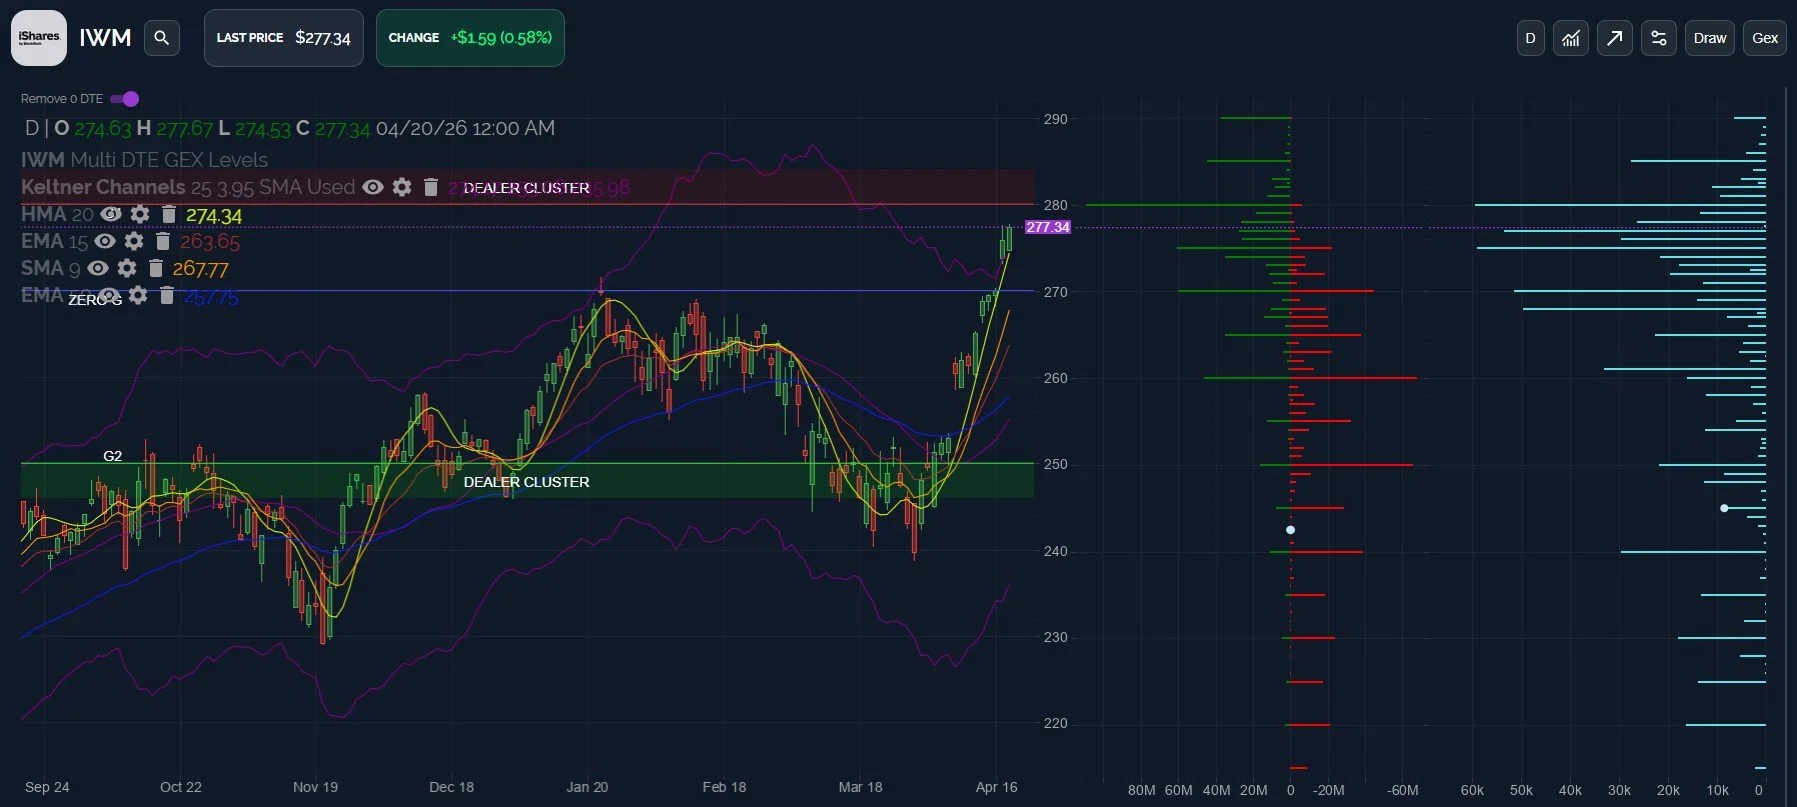
IWM was the most bullish index today, exceeding Friday’s high by 0.04 and closing near highs. We see positive GEX at 280 that appears to be a likely target.
I’ve excluded 0 DTE GEX and 0 DTE volume on our chart for the sake of showing that we still don’t see a lot of volume above 280, with most of the volume concentrated between 260-280.
The HMA is now above the upper Keltner, and price doesn’t have to drop much to trigger a sell signal for me, with the HMA at 274.34. Any daily close below this and we may see a quick move to the 270 area, then 260-265.
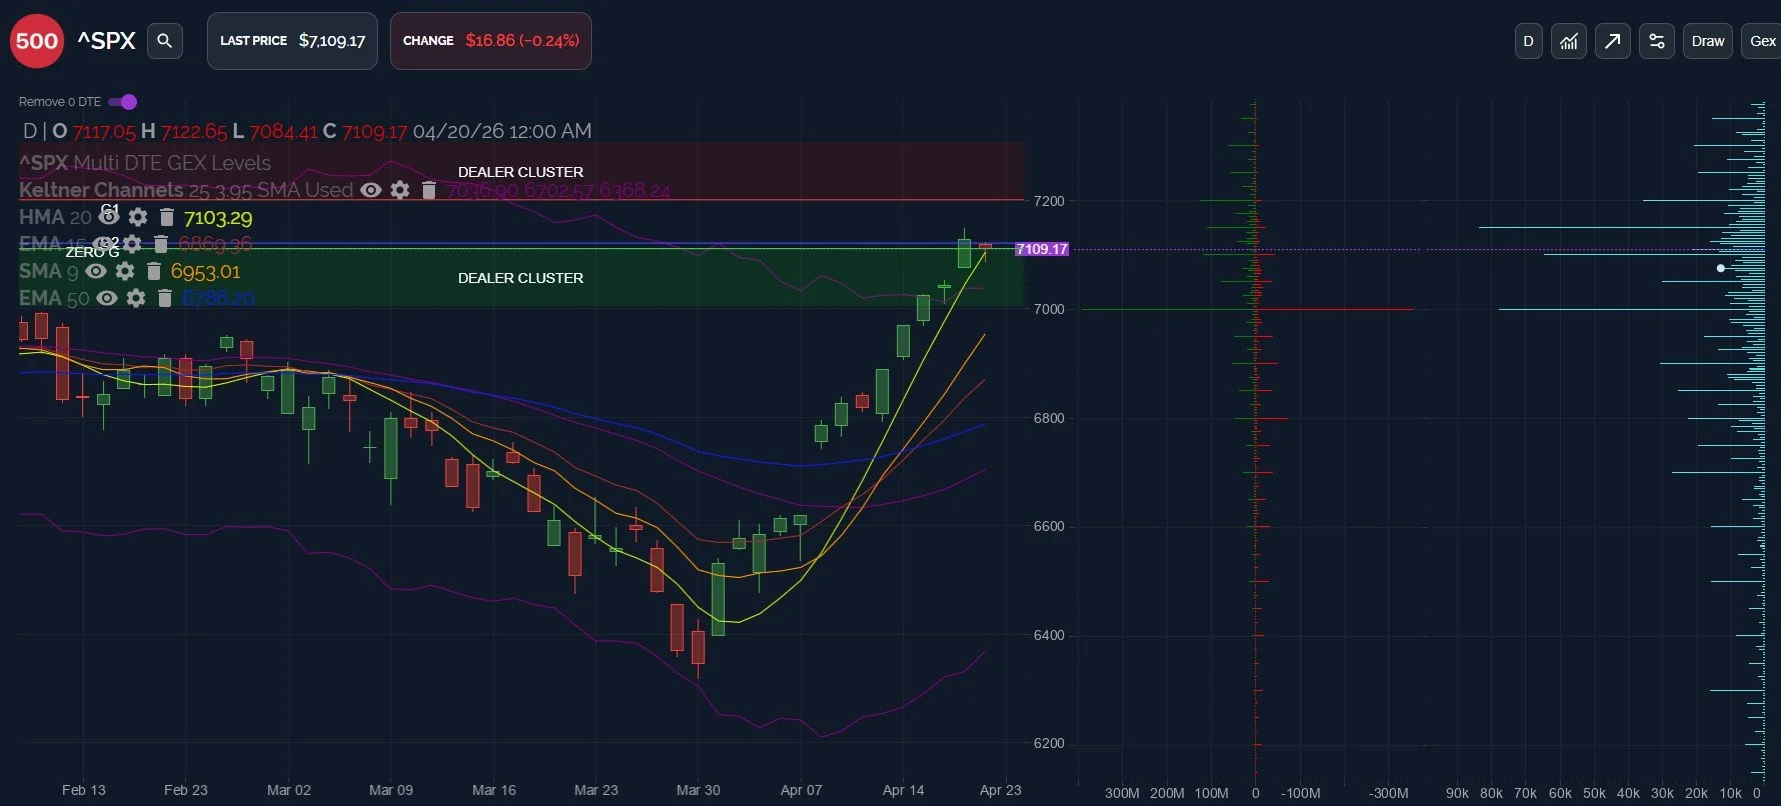
SPX is also very close to losing the HMA, in fact, much closer than IWM, closing merely 6 points above the 7103 HMA.
I’ve also excluded 0 DTE volume and GEX from the chart, showing the significant attention to 7150 as well as the 7000 strike.
I view the 7000 strike as a key pivot, one that we’ve repeatedly mentioned as we continue seeing the huge positive and negative GEX at 7000. This zone is barely 1.5% away and I see it as a likely initial stop on any move lower, even if we maintain a relatively steep ascent to new highs later.
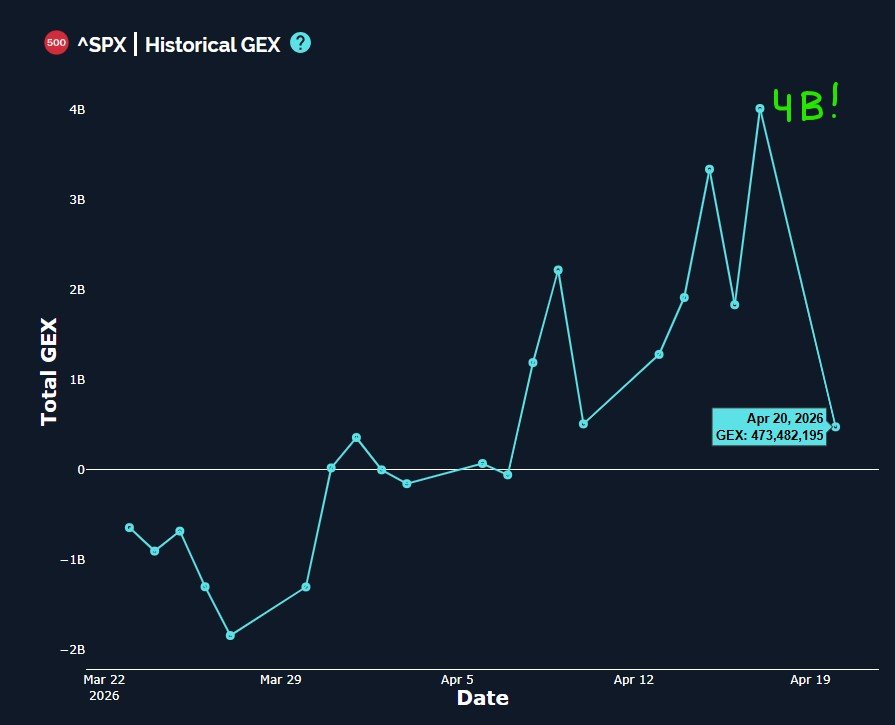
Today saw a huge move in net GEX, which isn’t surprising given that Friday was OpEx, but going from 4B to 473MM is quite a drop. Still positive though, albeit in neutral territory, in our opinion. This is certainly what we expect to see during or prior to a drop, even if it’s a modest one.
Let’s circle back to the idea of the pathway forward, stating the obvious that there are countless micro-pathways forward, and the GEX picture can change if we see volatility pick up again.
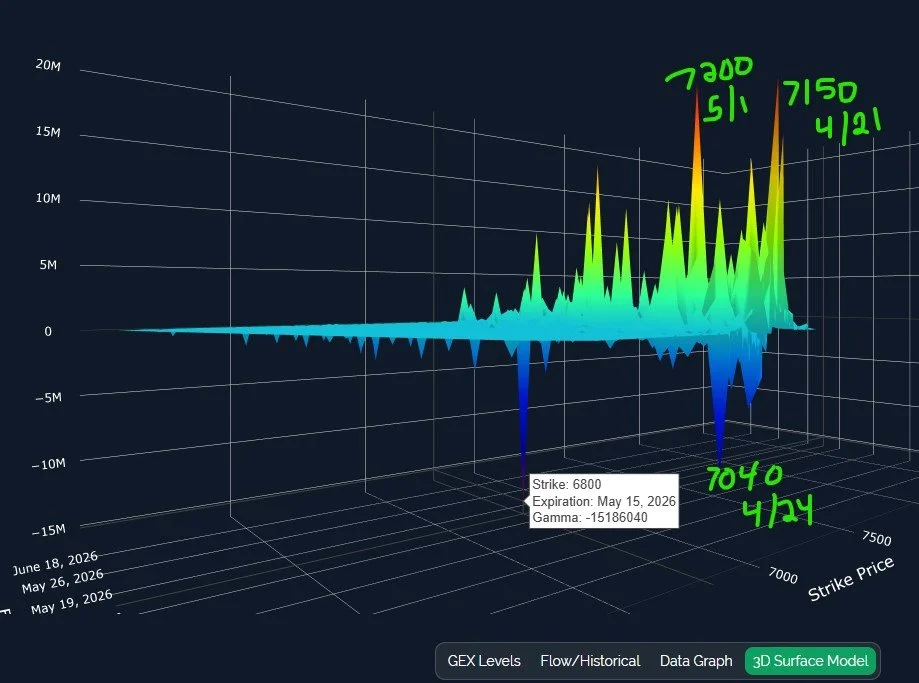
But for now, we have the largest positive GEX cluster this week at 7150, expiring tomorrow (the initial move up I mentioned earlier), 7040 on Friday (a move back down into the end of the week), then a rise to 7200 to start off May. 7200 is also the upper Dealer Cluster zone, which we typically view as a potential magnet in a positive GEX environment, other factors also considered.
Looking beyond May 1, we see 6800 as the largest cluster, representing negative GEX expiring May 15. Now we’re starting to get to some interesting levels for a dip buy..Or at least we hope conditions will support some bargain hunting at that time. Hope for the best, but plan for the worst, right?
We hope you’ll join us in Discord Tuesday, where we’ll share some of what we’re seeing on the GEX Dashboard in our general chat.
To enter Discord as a non-subscriber, go to our homepage and click on Community to enter our Discord server! First-time guests receive a free 7-day trial of the premium Discord channels and this is where we discuss what’s happening in real-time.
We conduct a livestream that is accessible from our homepage every day around 10:30am ET, so feel free to join us there. You can also listen to our most recent livestream any time before the next day’s livestream occurs.
Get $300 off of the annual Portfolio Manager subscription by entering TAXES2026 at checkout!
Thanks for being part of our community and know that we invite and appreciate your feedback!
The information provided by Geeks of Finance LLC is for educational purposes only and is not intended to be, nor should be construed as, an offer, recommendation or solicitation to buy or sell any security or instrument or to participate in any transaction or activity. Please view our Investment Adviser Disclaimer and Risk Disclosure.