
Extremes Into The Beginning Of The May OpEx Cycle? April 20 Stock Market Preview
Get $300 off of the annual Portfolio Manager subscription by entering the new code TAXES2026 at checkout! This will only last a few more days.
Tonight’s YouTube video covers SPX, the VIX, BTC, AMD, HOOD, and more, so check it out if you have a few extra minutes! You can view the video as well as our library of previous videos by clicking Community at the top of our homepage to find our YouTube channel link.
As indices seem to be on a rocketship to Uranus, several contrarian signals are starting to show up, including the CBOE Options Equity Put/Call ratio, which has collapsed to a relatively low .53. This same ratio was just at .72 in late March.
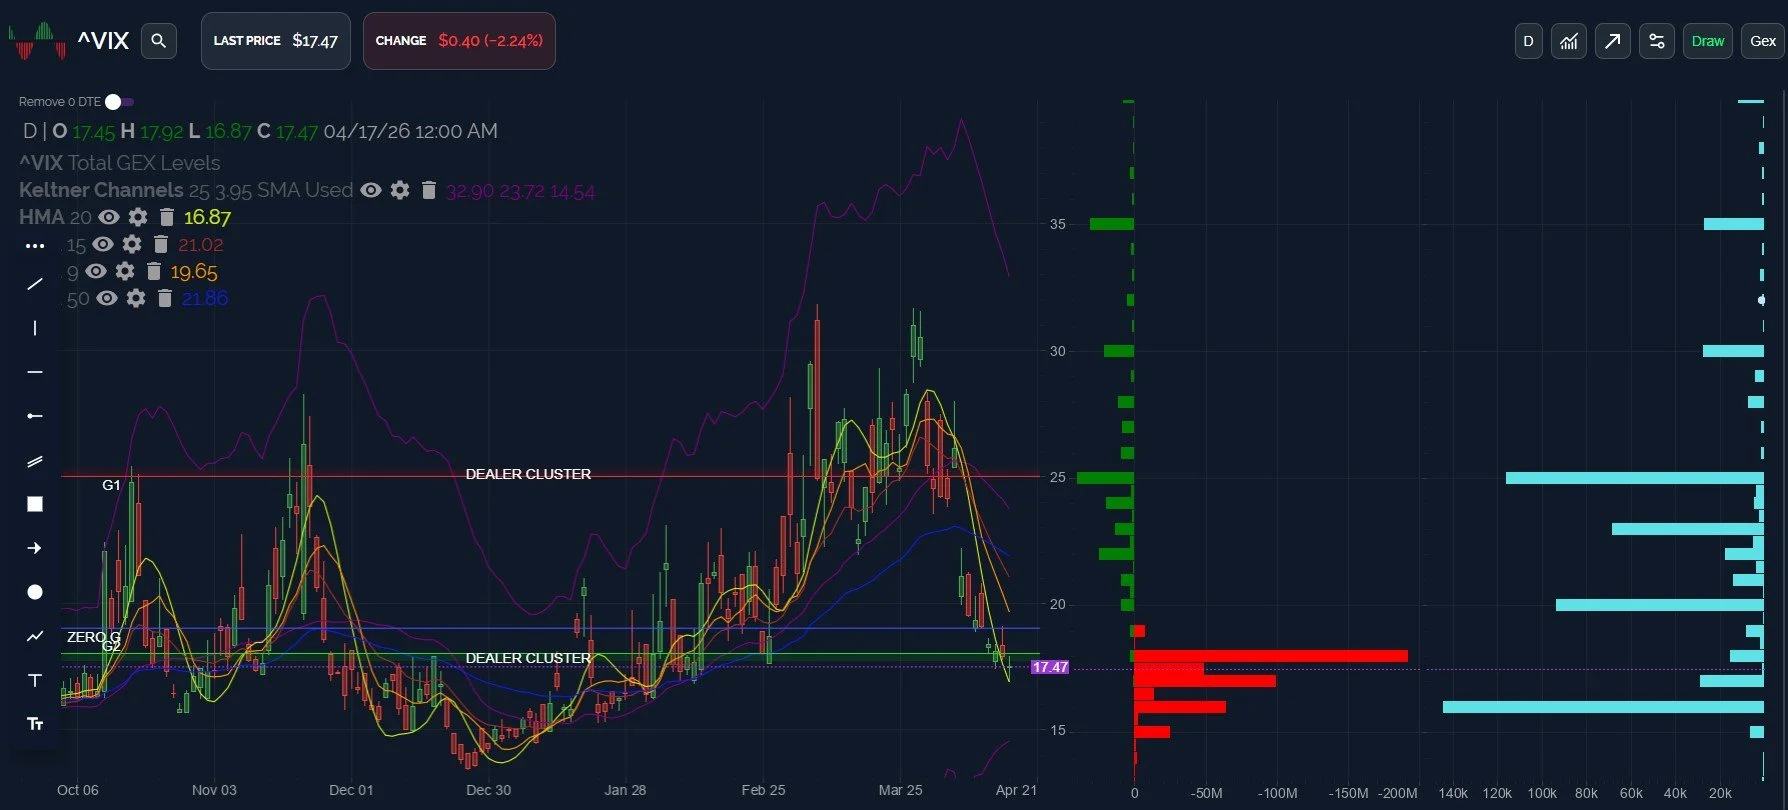
The VIX just completed only its 2nd day since March 30 to close above the daily HMA, and both of those days happen to be consecutive. I consider a close above the line to be a long signal, though with the HMA still declining, this signal may mean a VIX spike followed by a collapse to new VIX lows for 2026, even if the VIX maintains above the HMA. I want to see the HMA flatten out and turn higher if the VIX intends on another resumption of the broken uptrend, so I’ll continue watching.
As of Friday, the VIX appears to need a push through the big negative GEX cluster at 18 to improve the odds of a spike toward 25, which I believe is possible based on GEX. Technically, 21-22 would be an initial first test of resistance, as mentioned in the YouTube video.
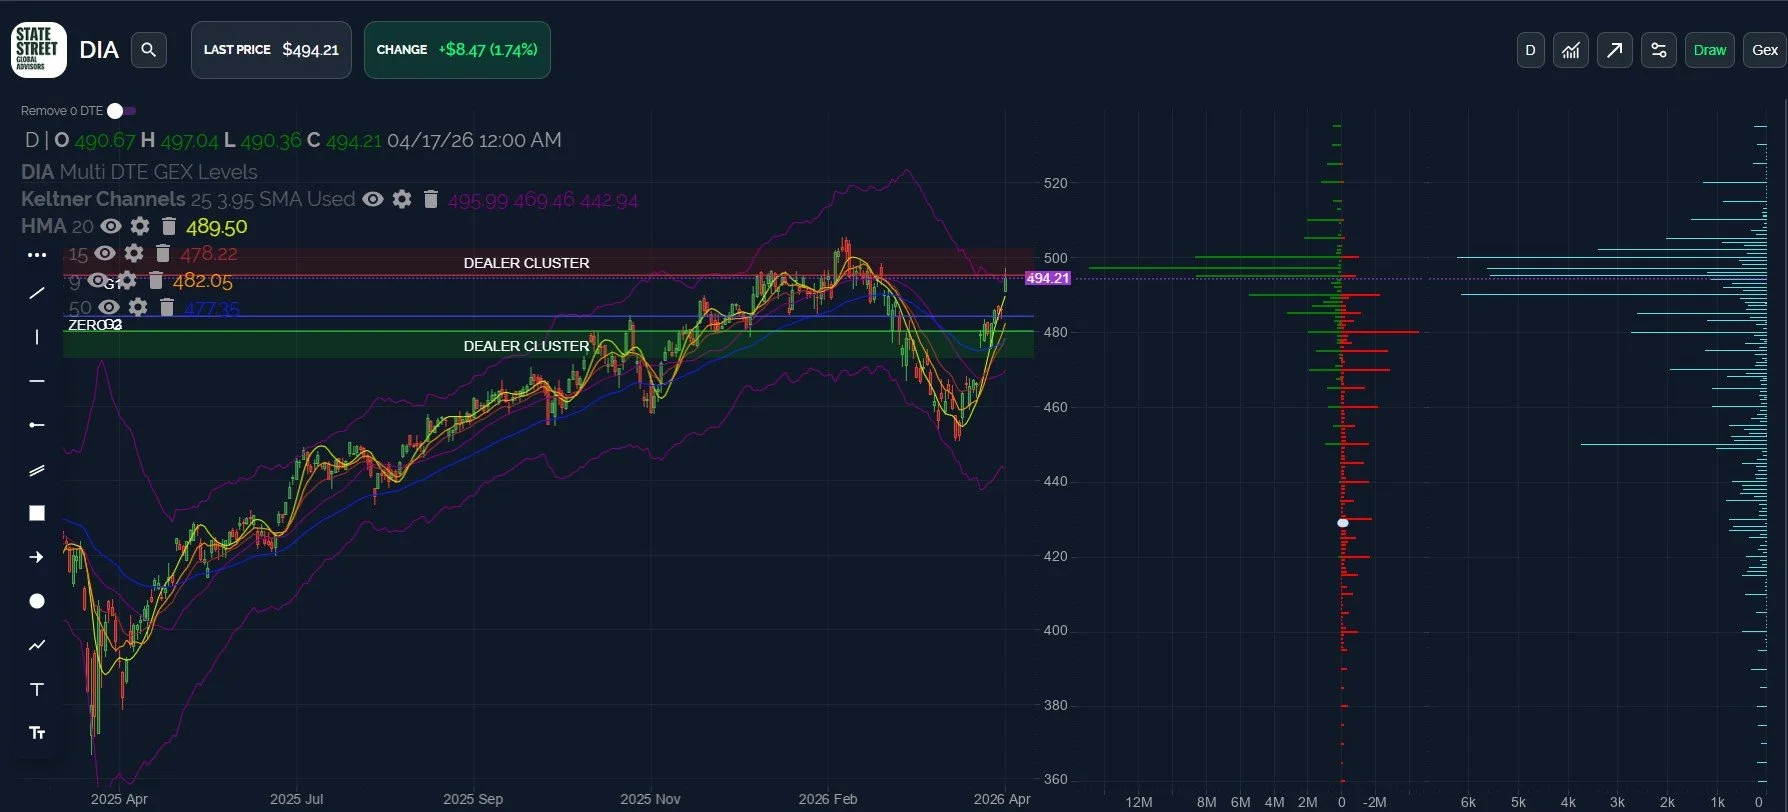
DIA did play “catch-up” somewhat on Friday, rising nearly 2% and beating the S&P and QQQ. In doing so, DIA has now also reached its upper Keltner channel, which I believe will prove to coincide with important resistance.
DIA’s lower high is a negative divergence compared to SPX and QQQ. We see most of Friday’s volume at the current price or lower, with particular interest in the outsized activity at DIA 450.
I don’t trade DIA often, but I think it’s helpful to consider differences in its action when looking at QQQ and SPX, which we’ll look at now.
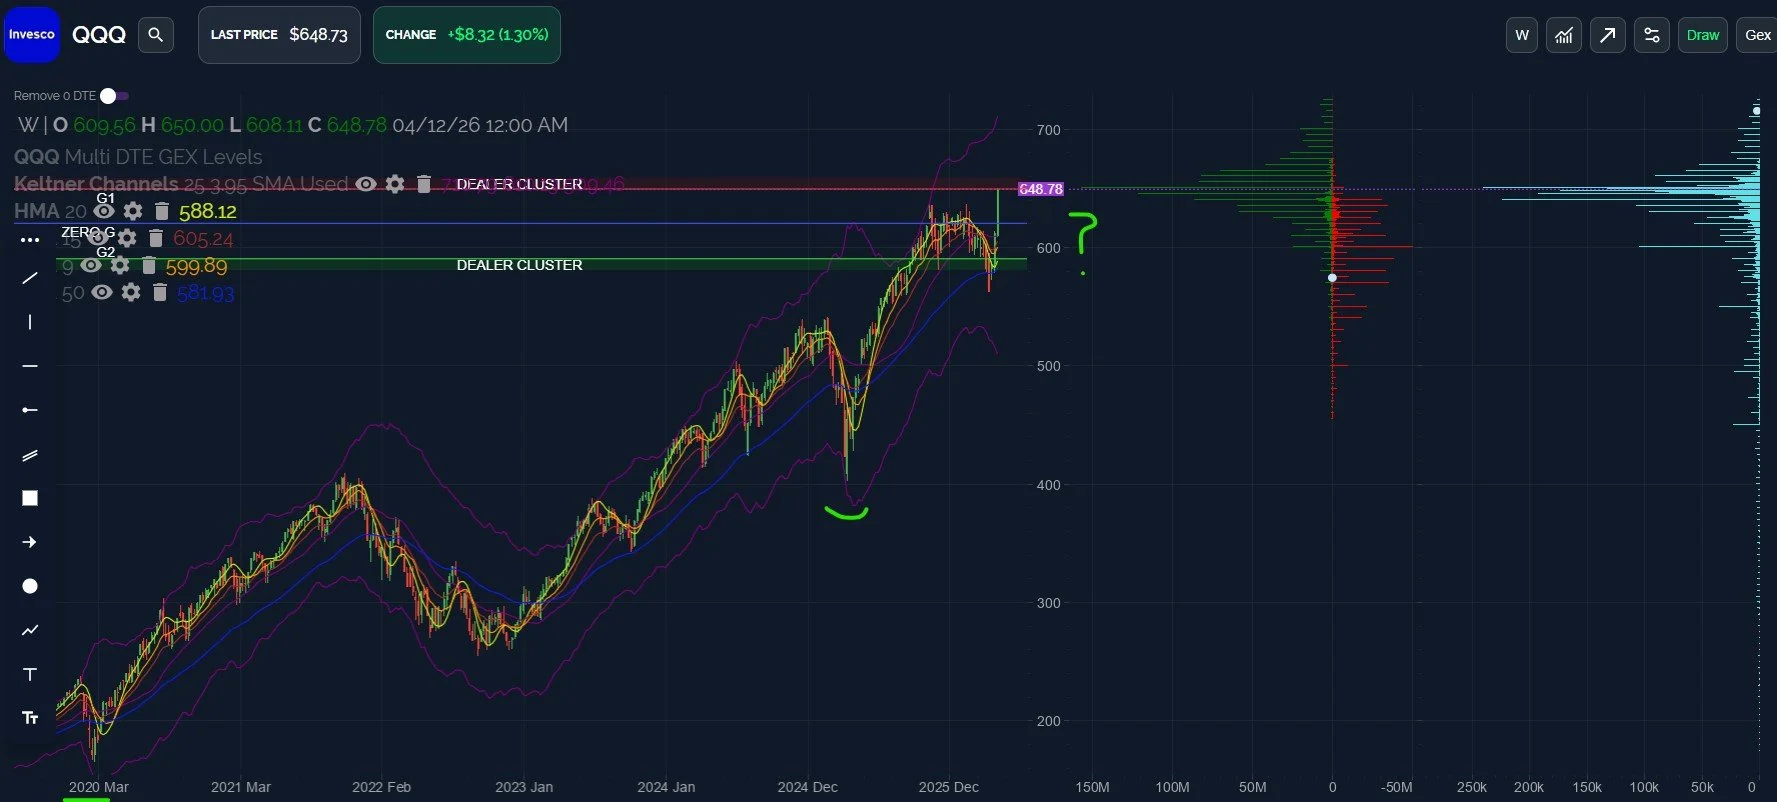
Speaking of QQQ, I wanted to zoom out to make some observations about the price in relation to both the HMA and the Keltner channels.
We have two prior instances visible on the chart (and I forgot to underline August 2024, which also counts, so three prior instances) where we see QQQ dropping between 45-65 points below the HMA.
Commonalities across all instances: The HMA is declining, and the overshoot to the downside reached the weekly lower Keltner channel in 2 out of 3 cases, with the August 2024 instance stopping at the 50 EMA instead. QQQ rebounded nicely from the lower channel and meaningful lows were made in those instances.
This brings us to our current amalgamation: Instead of overshooting dramatically to the downside, this time, we moved 60 points in a straight line up. We have similar distance from the HMA, no tag of a lower or upper Keltner, and the opposite direction of the underlying HMA.
Are we likely to see QQQ continue even higher, until it reaches the upper Keltner? I would suggest that this unusual setup may be more conducive toward mean reversion back down, especially given the 60 point gap between price and the HMA.
QQQ is in the upper Dealer Cluster zone and we see notable volume at the 600 strike, which I believe generally favors the odds of a pullback.
We have a similar set of circumstances for SPX on the chart, with the current distance between the HMA and the current price being roughly 520 points.
One big difference for SPX: While we do see high volume at 6000, we also see high volume at 8100 and 8300. I don’t see any statistically sound way to give high odds of momentum straight to 8300, so any needle spike beyond what we’ve seen falls into the “no one can predict that” category. I’d rather see a nice pullback before working our way higher, though a move straight up would elicit a hearty laugh.
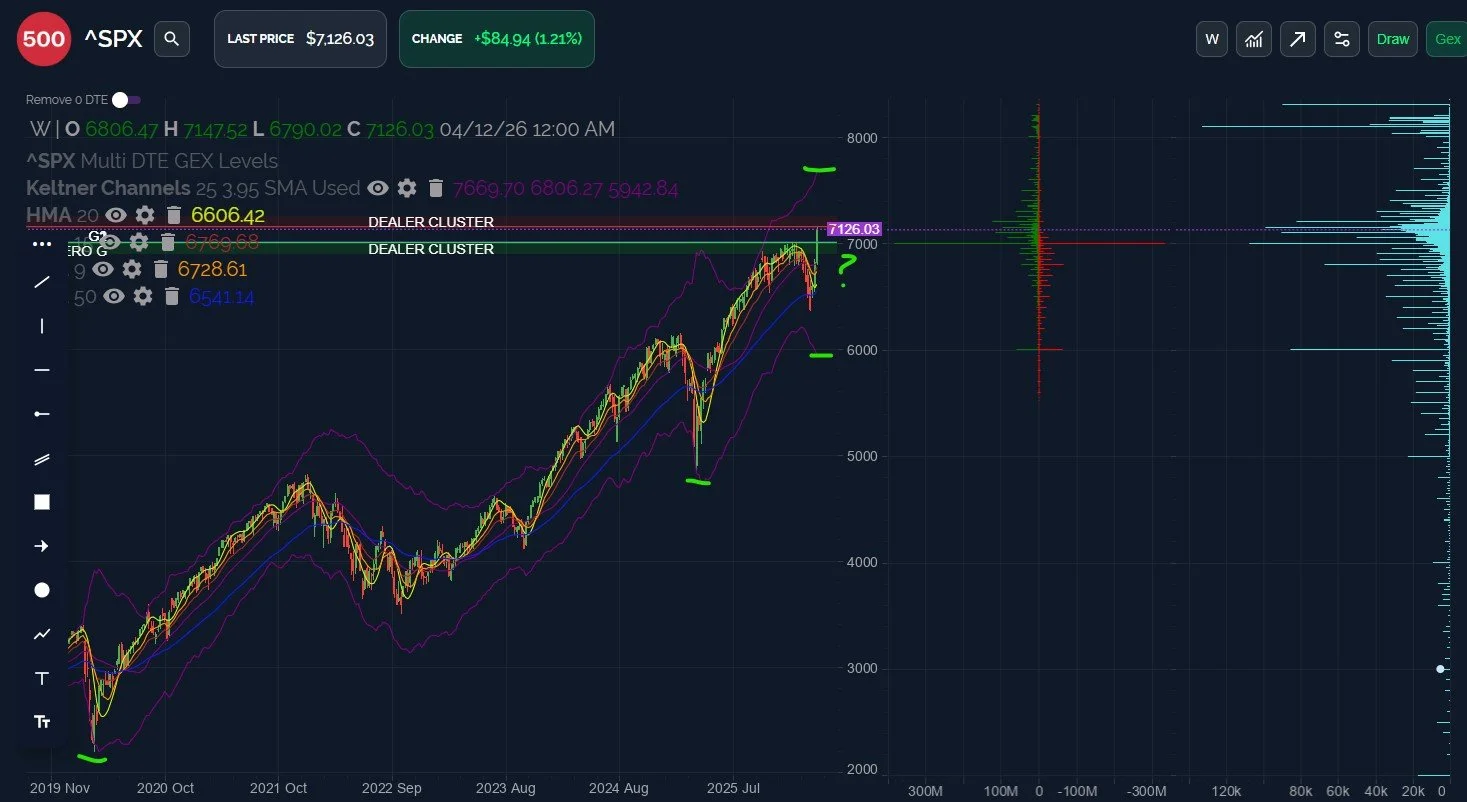
On the daily chart, SPX is over the upper Keltner channel and the HMA is also about to cross over the upper Keltner, which creates a headwind for SPX to stay above the HMA, since extreme positive momentum is required to maintain above the line.
Any pullback will meet initial support at 7000. From a theoretical behavioral perspective, I would expect those on the sidelines who were caught by surprise with the strength of the rebound to initially attempt to buy at 7000. Those of us expecting the lower gap to be filled may have to wait a few days/weeks at a minimum. Once again, in theory.
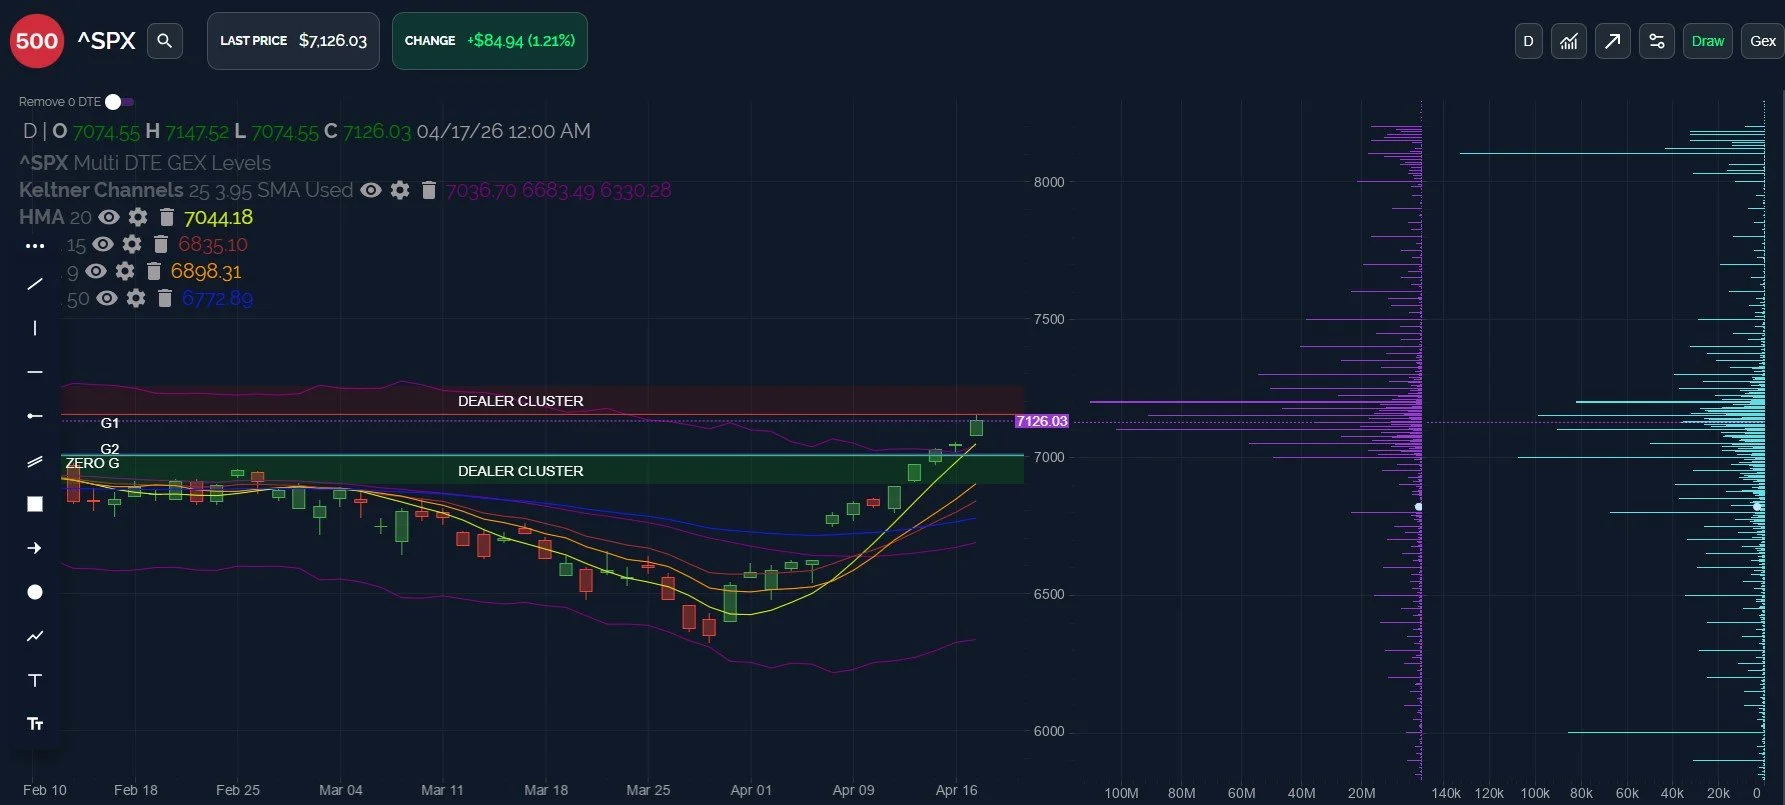
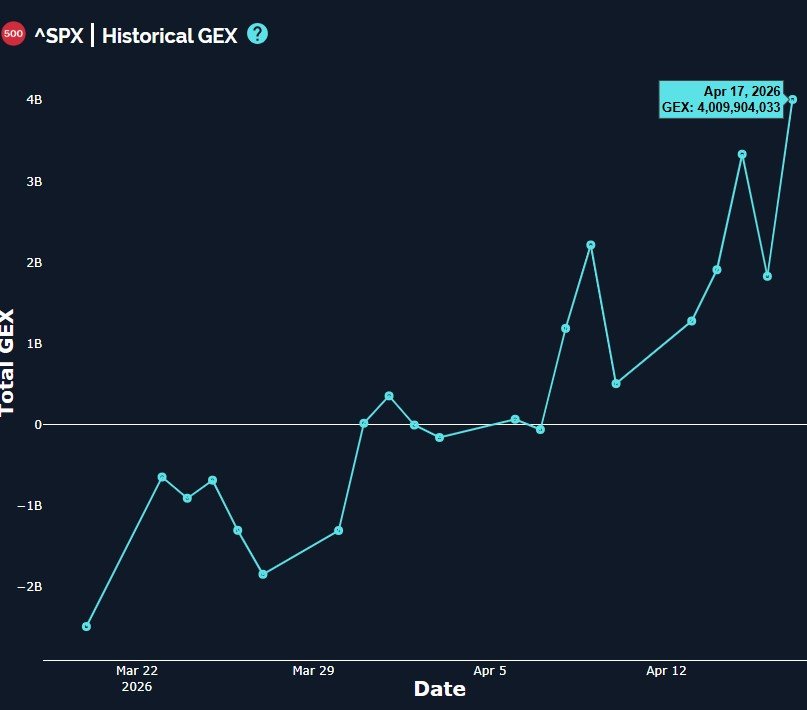
SPX also printed another extreme positive GEX reading, a rare closing GEX value compared to other closes over the last year. This potentially contrarian signal may add to the other items on the list point to an imminent pullback.
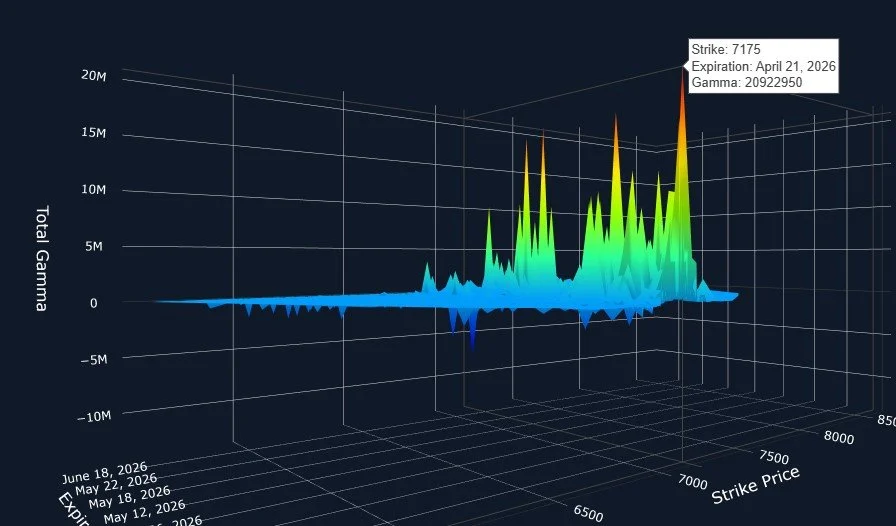
We do need to check the 3D model once Monday’s cash session starts to see if the big positive GEX cluster at 7175 is still looming for Tuesday the 21st. If so, we may treat any dip on Monday as a buying opportunity.
Without a meaningful pullback, we’ll continue to move forward with caution, since we feel that a nice reset is necessary before more sustainable upside. We’ll take in the clues afforded by the market and we hope you’ll join us in Discord where we’ll share some of what we’re seeing on the GEX Dashboard.
We appreciate your involvement and we look forward to seeing you in our Discord community , where we’ll continue the discussion as we enter Monay’s cash session!
To enter Discord as a non-subscriber, go to our homepage and click on Community to enter our Discord server! First-time guests receive a free 7-day trial of the premium Discord channels and this is where we discuss what’s happening in real-time. Thanks for reading!
We conduct a livestream that is accessible from our homepage every day around 10:30am ET, so feel free to join us there. You can also listen to our most recent livestream any time before the next day’s livestream occurs.
Get a big $300 discount for the annual Portfolio Manager subscription by entering TAXES2026 at checkout!
Thanks for being part of our community and know that we invite and appreciate your feedback!
The information provided by Geeks of Finance LLC is for educational purposes only and is not intended to be, nor should be construed as, an offer, recommendation or solicitation to buy or sell any security or instrument or to participate in any transaction or activity. Please view our Investment Adviser Disclaimer and Risk Disclosure.