
The Rebound Is Here: How Far Can We Go?
THE SPRING PROMO IS HERE- We’re offering $300 off of the annual Portfolio Manager earlier than usual in March as we wrap up the 1st quarter of 2025 and celebrate the release of major updates last week! We now have overlayed chart indicators and several backtested algos complete with notifications and we anticipate more near-term improvements. Your needs are our focus, and we want the platform to become indispensable for your trading! Enter code SPRING2025 at checkout to take advantage of this limited time offering.
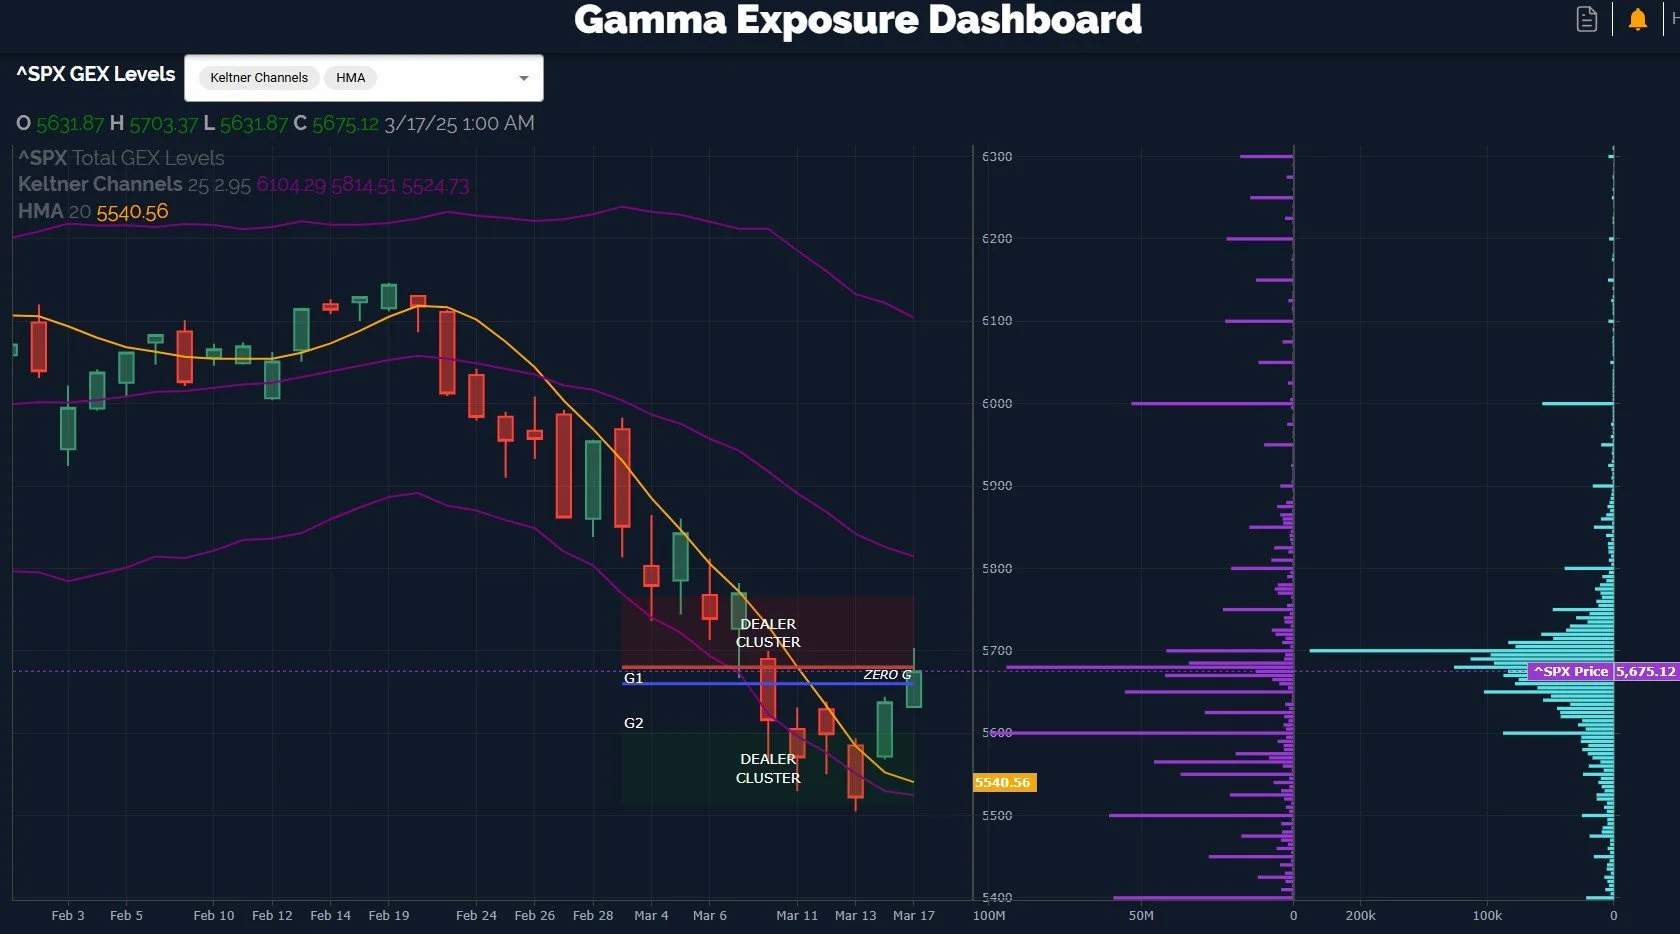
The spell that was cast for the previous two weeks in a row has been broken. Big, green Friday performances didn’t lead to a big red day on Monday. How nice! We also see vindication of some of the indicators we like to use, with the follow-through today after closing decisively above the Hull Moving Average. Apparently “decisively” is important, which I’ll note in hindsight after being perhaps too optimistic with the close right on the line a couple of days prior. Gamma exposure (GEX) gave us a great early indication today of where we were initially headed, with 5680 sticking out like a sore thumb, and positive GEX remaining in command even when we saw SPX’s price falter early in the day. We shared this in Discord in our free General Chat channel, which you can join by clicking the link at the bottom of the page.
The question now is how far will this rebound take us? Was today “it?” We have monthly VIX options expiring Wednesday pre-market and monthly OpEx for indices Friday, so we could potentially see more than one shift in choppy fashion, destroying call and put premium, in theory. Let’s see what SPX and QQQ have to say:
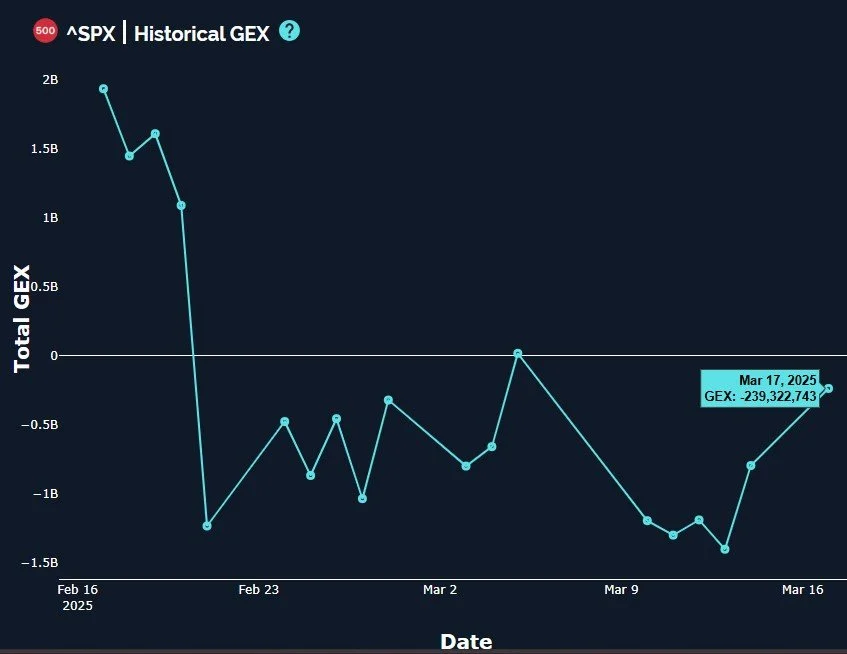
SPX saw a big decrease in negative GEX (said otherwise, a big move toward positive GEX) over the last two sessions, putting SPX firmly in the neutral zone and only 239M away from the zero line. As you can tell above, SPX hasn’t put two meaningfully positive GEX days together since the decline started back in February. To temper outright optimism, note that the last time we visited the zero line, SPX rejected a move into positive territory and sunk back to the backseat of a bumpy rollercoaster. We will look at a variety of possible signals when we reach that point again to ascertain whether or not we think we will head back down again.
SPX’s GEX picture looks interesting, with a lot of negative GEX clusters still looming, though the upside looks interesting as we have a big positive cluster at 6000 and not much in between. Imagine getting back to 6000 by the end of the quarter…Like nothing ever happened. Then how dumb will you feel for not buying the dip? Alright, this isn’t a beatdown session, let’s move on.
In all seriousness, with the Hull and the lower Keltner still below 5600 (yet showing early signs of attempting to turn higher), we can’t be surprised by a down day this week that attempts to retest or break that area again, it would be natural after staying below the Hull since late February. Even if we don’t drop back to that area soon, it’s good to keep possibilities in the back of our minds so we’re prepared to react in what seems to be a rational manner.
QQQ also saw a meaningful reduction in negative GEX, which is interesting given that a lot of big tech names were still down in the dumps today. Both MSFT and META, which we highlighted in yesterday’s newsletter, did virtually nothing today. I don’t like that MSFT’s lower Keltner continues moving lower, though I place less tactical emphasis on that data point since its price is above the Hull. We’ll have to keep an eye on tech. Could this be a true rotation occurring, after years of false starts? I hate to try to be the first one to get that one right when the road is littered with wrong predictions of “the rotation is here!” over the last decade or longer.
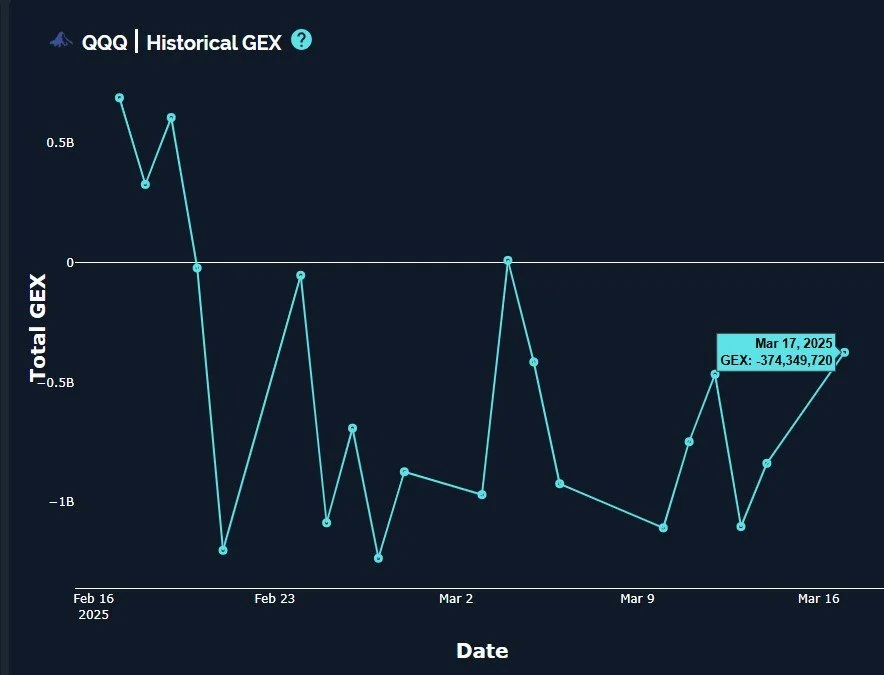
If tech does play catchup with the more positive looking SPX and IWM, all of the large negative GEX clusters and lack of positive clusters could see this thing fly if shorts are forced to cover. A retest of 500 seems reasonable. Interesting possibilities lie ahead.

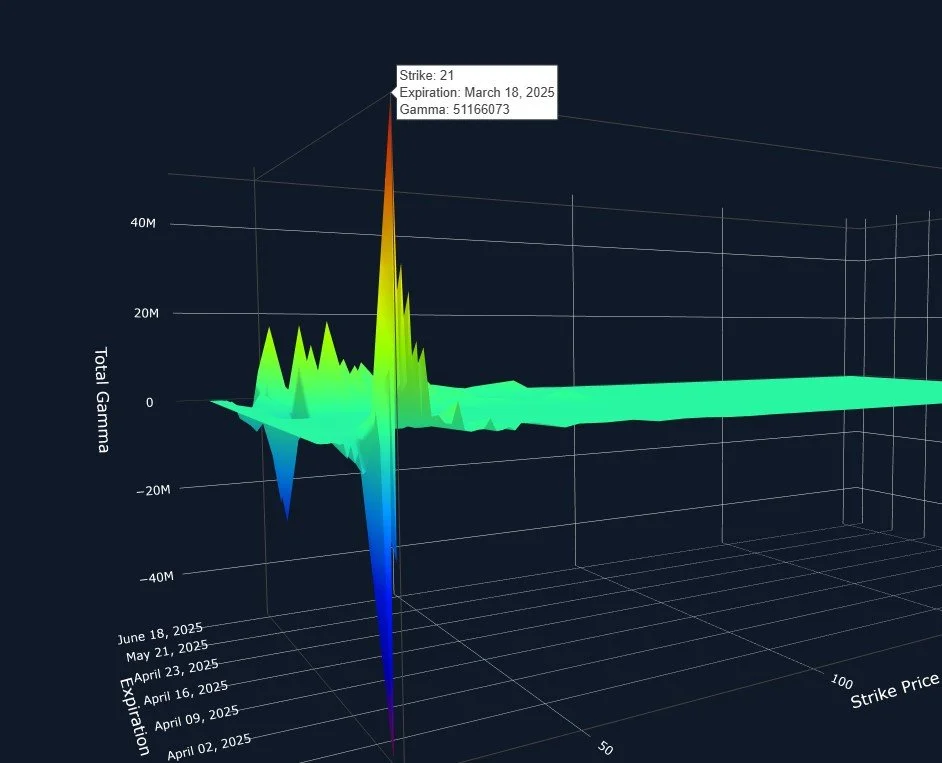
We saw an interesting intraday shift in VIX GEX as well, with the VIX still showing positive total GEX, but the GEX at higher strikes dropped dramatically, shifting down to 20 and especially 21 as the largest positive strikes and 20 as the largest negative strike. With these options expiring Wednesday, and volume primarily at lower strikes today (including the 15 strike), I wouldn’t be surprised to see the VIX rangebound between 19-22. We still see some positive GEX at 23 and 25 strikes, but not nearly what it was this morning.

With the positive and negative VIX options being removed Wednesday, we may see the door opened to a move in the opposite direction or possibly an acceleration for indices as participants evaluate the new option landscape at that time. We’ll remain open-minded and let’s take it one day at a time.
Here’s the Discord link if you haven’t joined us yet! Access is free for some channels, and new members have a 7-day trial within Discord to see how we operate. We have an active community of thoughtful traders who chime in throughout the day, sharing ideas and opportunities as we see them.
If you’re interested in accessing our tools and analytics, be sure to check out our website! We rolled out backtested algos and chart indicators and we have more improvements on the way!
If you’re interested in learning more about our strategy and approach, we address all of these topics in our Geek University course which is included in all memberships.
We recently posted a YouTube video, and we have many other short videos, so give our channel a look if you’re curious about recent market commentary and ideas as well as gamma (GEX) concepts explained.
Thanks for being part of our community and know that we invite your feedback!
The information provided by Geeks of Finance LLC is for educational purposes only and is not intended to be, nor should be construed as, an offer, recommendation or solicitation to buy or sell any security or instrument or to participate in any transaction or activity. Please view our Investment Adviser Disclaimer and Risk Disclosure.