
SPX Holding Below Resistance: March 12 Stock Market Preview
Get $300 off of the annual Portfolio Manager subscription, enter code SPRING2026 at checkout!
Tonight’s YouTube video looks at the latest moves in SPX, the VIX, IWM, AMD, and AMZN, so check it out! You can view tonight’s and prior YouTube videos by clicking Community at the top of our homepage to find our YouTube channel link.
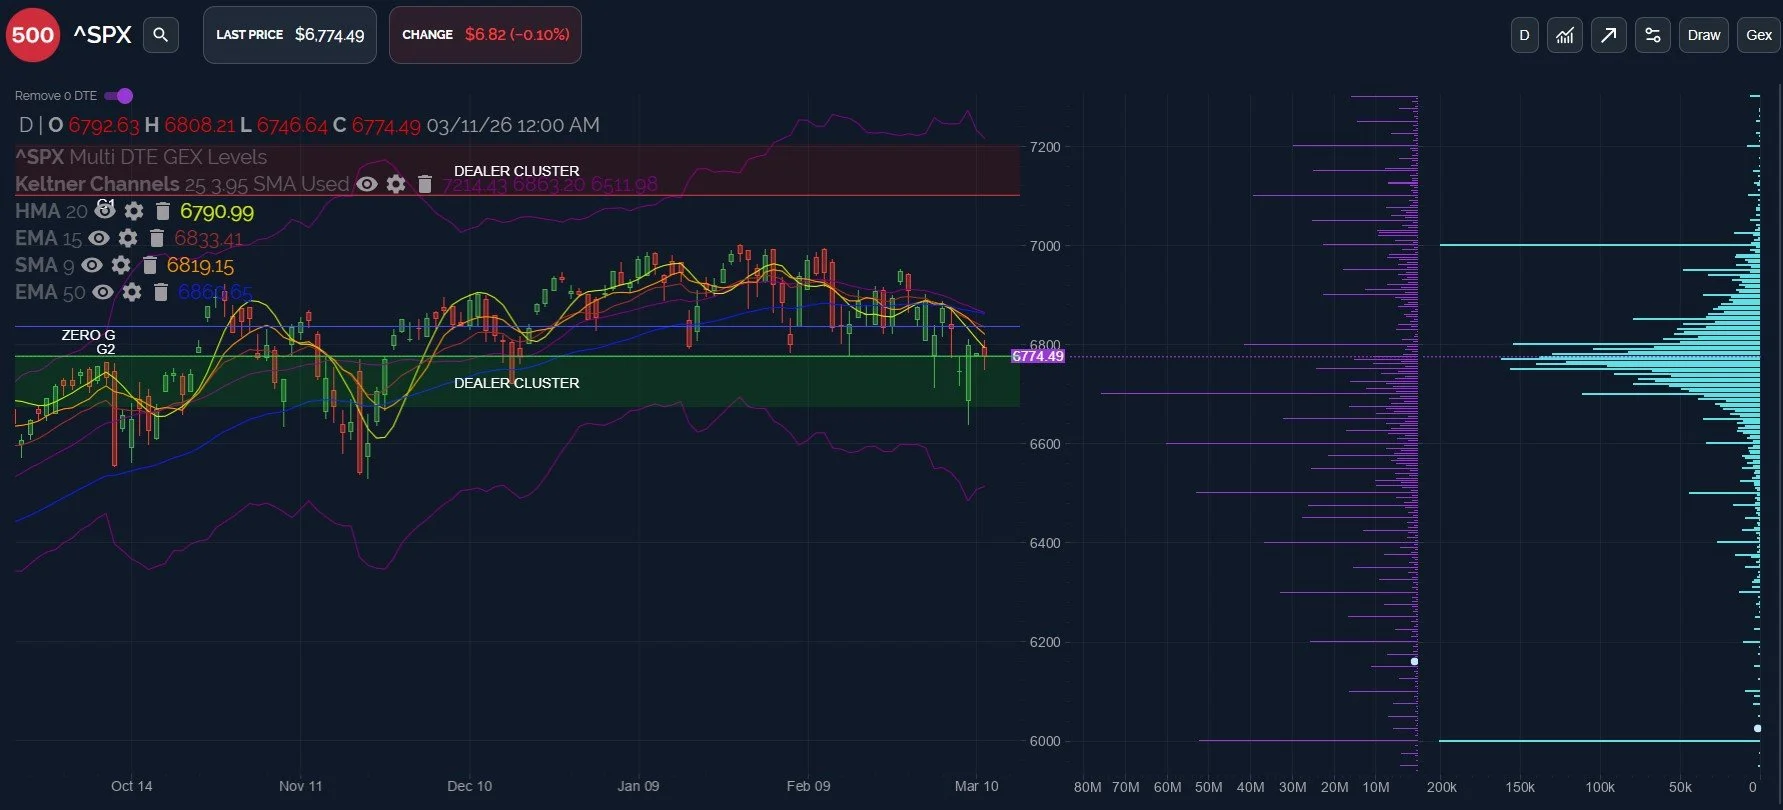
So far this week, we’ve seen the market make lower lows for 2026, and we still maintain levels below the key declining moving averages on the chart, even with the intraday rebound Monday.
SPX is below the daily 50 EMA, and with the weekly 50 EMA looming below at 6512.91 (almost perfectly matching the lower daily Keltner channel at 6511.98, I might add), we still see a risk of edging closer toward that area.
Closing above 6820 (in my opinion) would likely invalidate the immediate downside risk and open the door to 6900+, but the current momentum (as measured by rejection at the highs) still appears to be lower.
One potential positive- we still see outsized volume at the 7000 strike, as shown in light blue (note I excluded 0 DTE GEX and volume on the chart below):
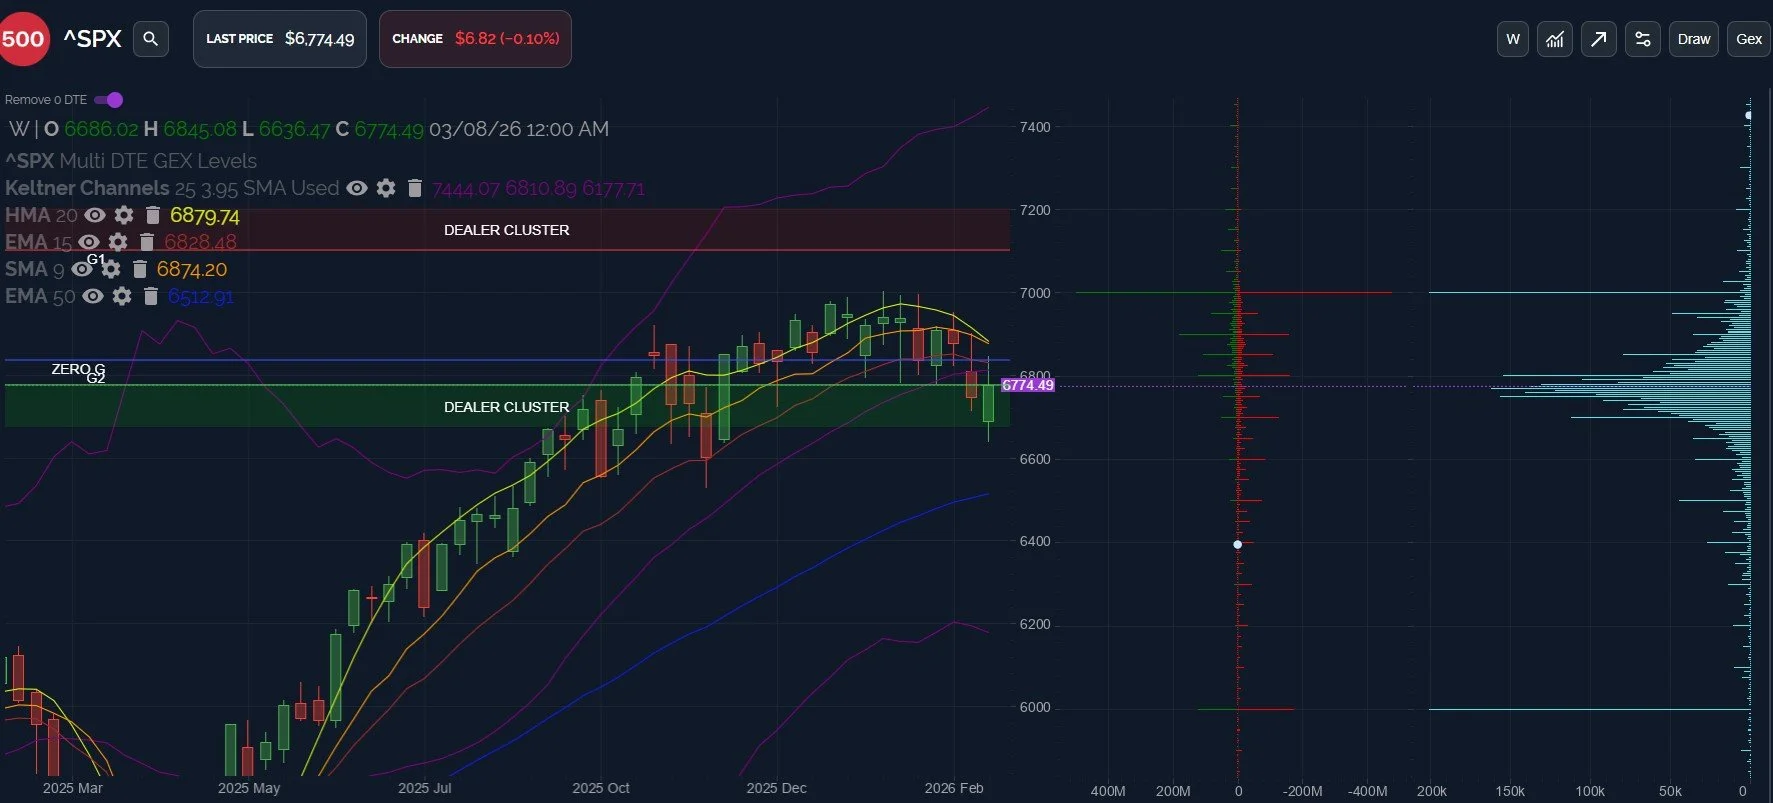
Zooming out to SPX’s weekly chart, you can see the 50 EMA in blue, and the weekly HMA and 9 SMA are within 5 points of each other at 6874 and 6879.
The confluence around the 6880 area could act as resistance if we see SPX overtake 6820, also potentially serving as a pivot toward 7000, if we see SPX hold above on a daily or weekly close. The burden of proof remains upon bulls, given the recent tendency of SPX to reject from those moving averages as resistance.
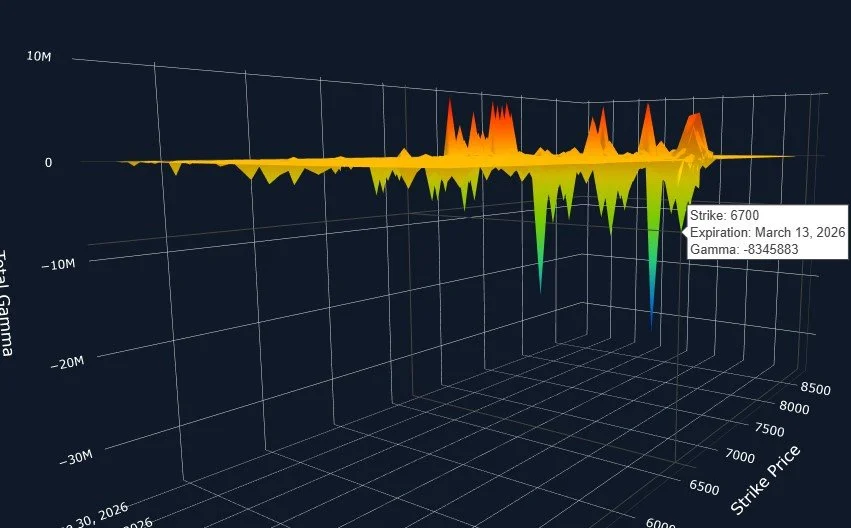
The largest net GEX cluster expiring Friday for SPX is at 6700, and concerningly for bulls, 6575 is also larger than the positive GEX we see at 6900 for Friday or Monday. Can this change by Friday? Of course, but as of now, these negative GEX clusters represent a larger potential target than 6900.
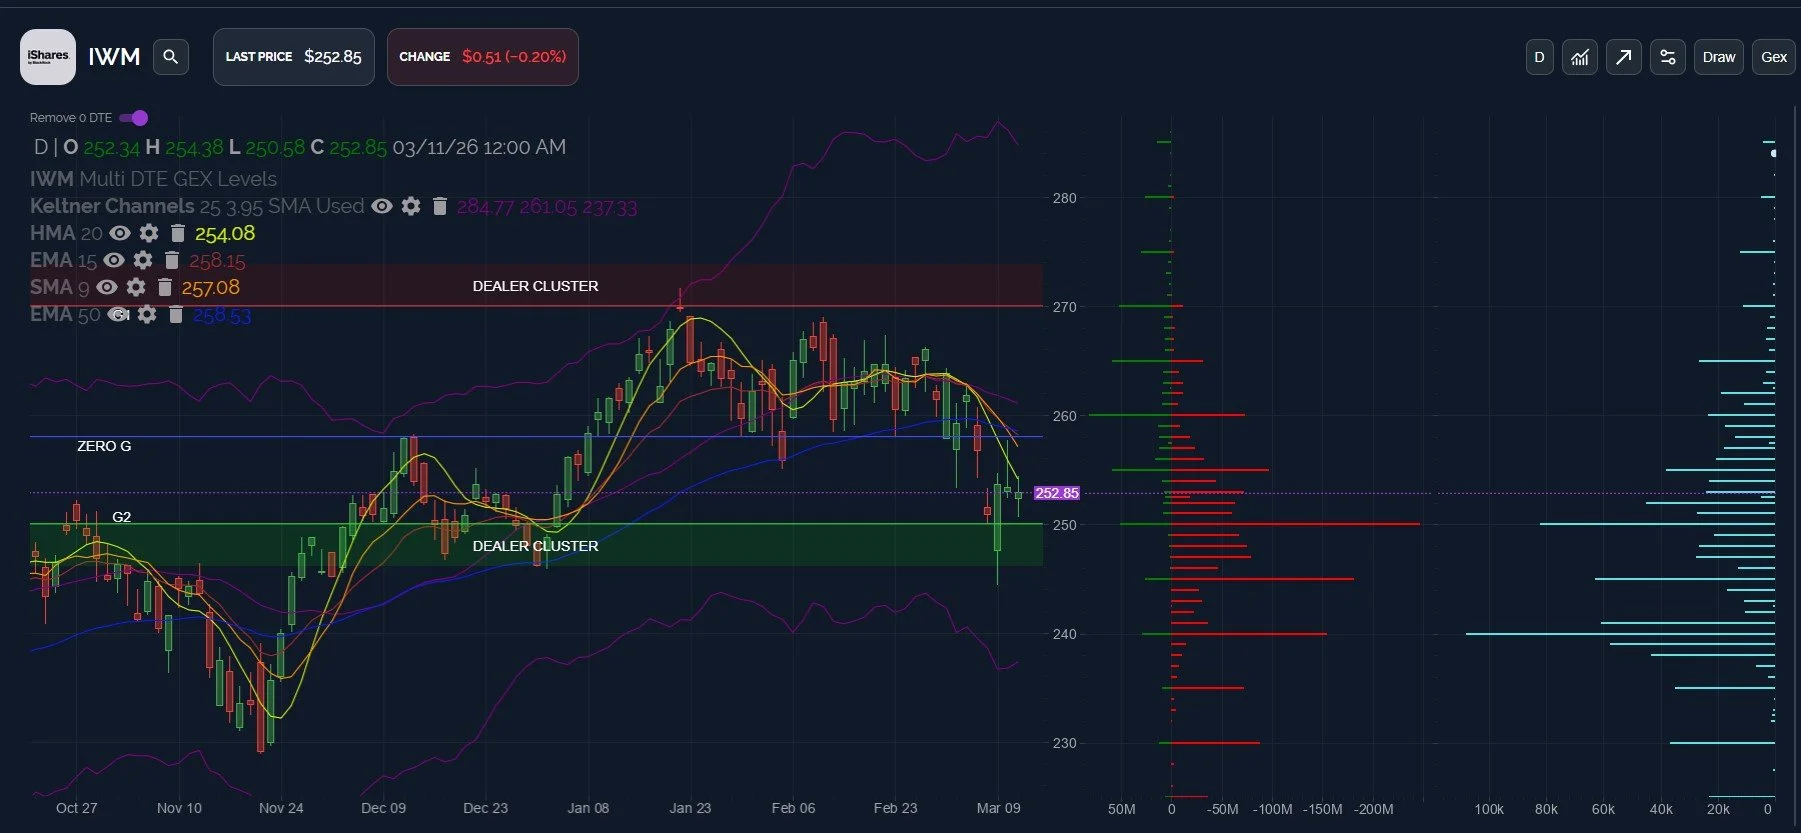
IWM also continues rejecting overhead resistance, and we continue seeing elevated volume at 240.
IWM’s lower Keltner channel is within 3 points of 240, which I view as a potential downside target.I’m also watching the GEX Intensity gauges for all indices in hopes of seeing a contrarian extreme negative reading, though that’s not a primary factor in my own analysis.
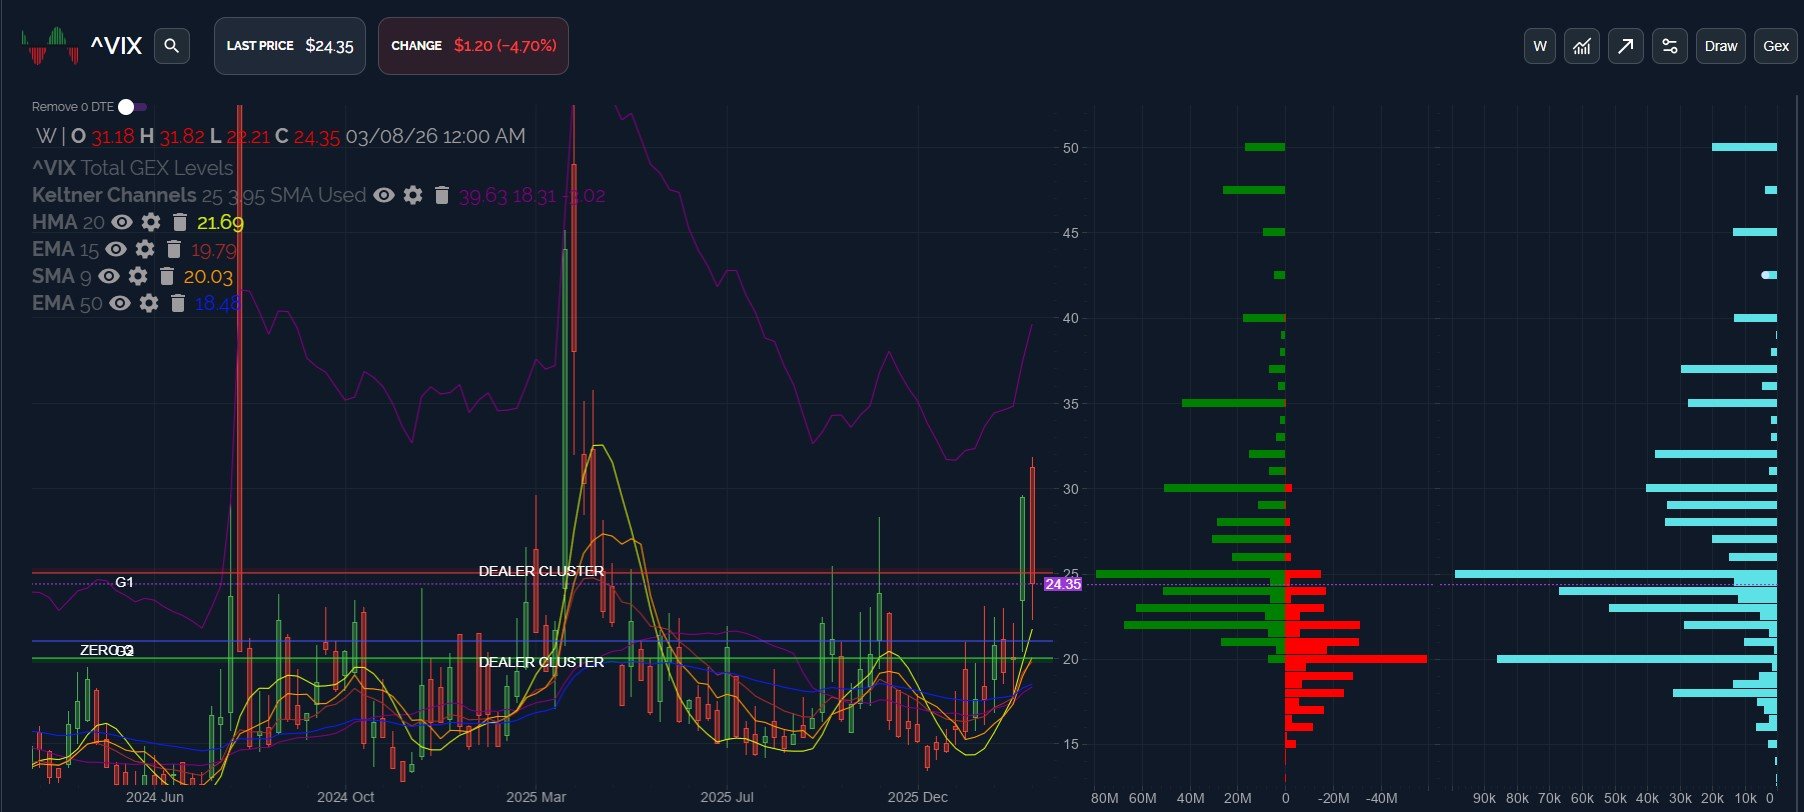
Lastly, the VIX reading is somewhat unclear on the daily chart, but on the weekly chart, we see the VIX holding this week’s test of the rising HMA and GEX remains positive.
The upper Keltner channel is pointing sharply higher at 40, though 35 represents the largest GEX cluster beyond 30.
Interestingly, 47.5 reflects more GEX than at 40, but we actually see more daily volume today at strikes between 20 and 30 than anywhere else.
With OpEx next week, as well as monthly VIX expiration, we may be in store for some volatility in both directions, so we won’t get too comfortable based on any one day’s data. We’ll continue watching intraday GEX shifts and the 0 DTE picture on major indices for additional clues, and we hope you’ll join us in Discord as we navigate the remainder of this week and next week.
To enter Discord as a non-subscriber, go to our homepage and click on Community to enter our Discord server! First-time guests receive a free 7-day trial of the premium Discord channels and this is where we discuss what’s happening in real-time.
We conduct a livestream that is accessible from our homepage every day around 10:30am ET, so feel free to join us there. You can also listen to our most recent livestream any time before the next day’s livestream occurs.
We’re still running an annual discount for the annual Portfolio Manager subscription, so enter SPRING2026 at checkout!
Thanks for being part of our community and know that we invite and appreciate your feedback!
The information provided by Geeks of Finance LLC is for educational purposes only and is not intended to be, nor should be construed as, an offer, recommendation or solicitation to buy or sell any security or instrument or to participate in any transaction or activity. Please view our Investment Adviser Disclaimer andRisk Disclosure.