
Decision Time For The VIX: March 11 Stock Market Preview
Get $300 off of the annual Portfolio Manager subscription, enter code SPRING2026 at checkout!
We skipped the Youtube video this evening in order to expedite several new features we’re excited to roll out. You can view prior YouTube videos by clicking Community at the top of our homepage to find our YouTube channel link.
Indices rallied intraday, testing just above key resistance (on my chart), yet failing to hold the test of the 50 EMA.
I excluded 0 DTE GEX and 0 DTE volume on the chart below, revealing outsized volume at lower strikes compared to those above 610, and net GEX also represents larger targets at those lower strikes. 560-580 is still an area that I think might be visited IF we see QQQ lose 600 again.
Getting over 610 could target 615-620, though we really see diminished GEX above 625-630.
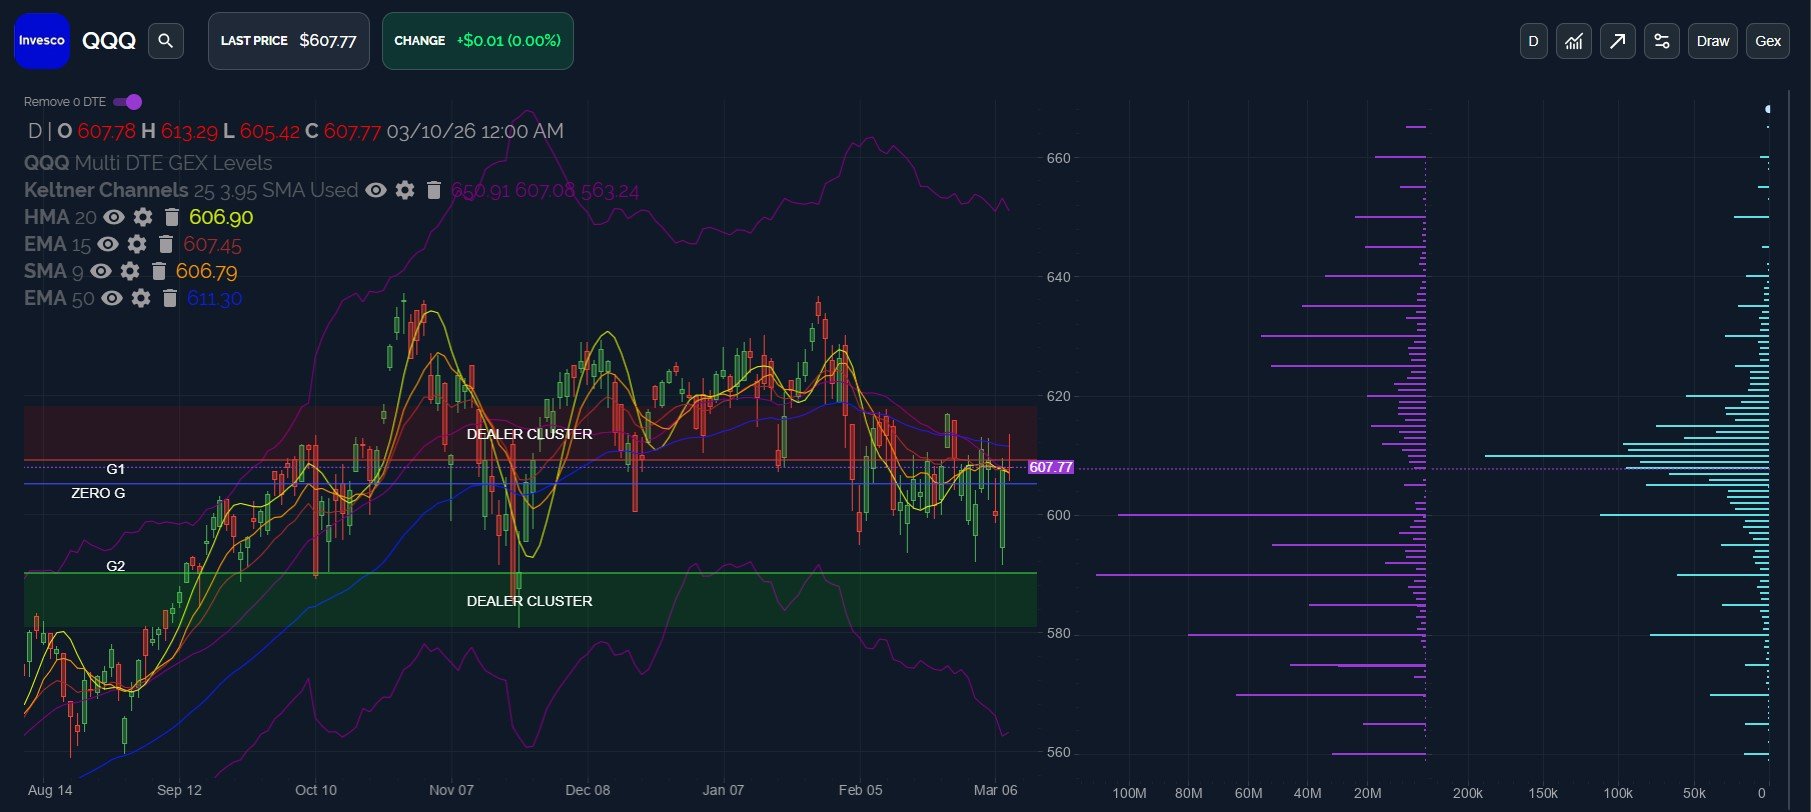
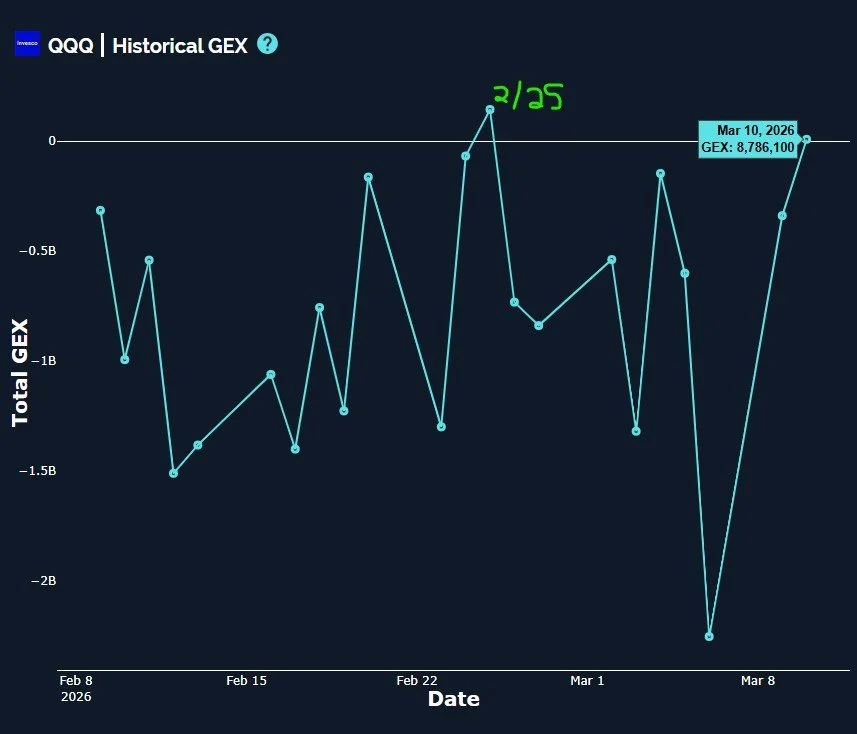
QQQ’s net GEX as of the close (including 0 DTE GEX) reached slightly into positive territory.
Note that February 25 was the last time we saw improvement into positive territory, and it ended up being within a day of the post-dip high at that time.
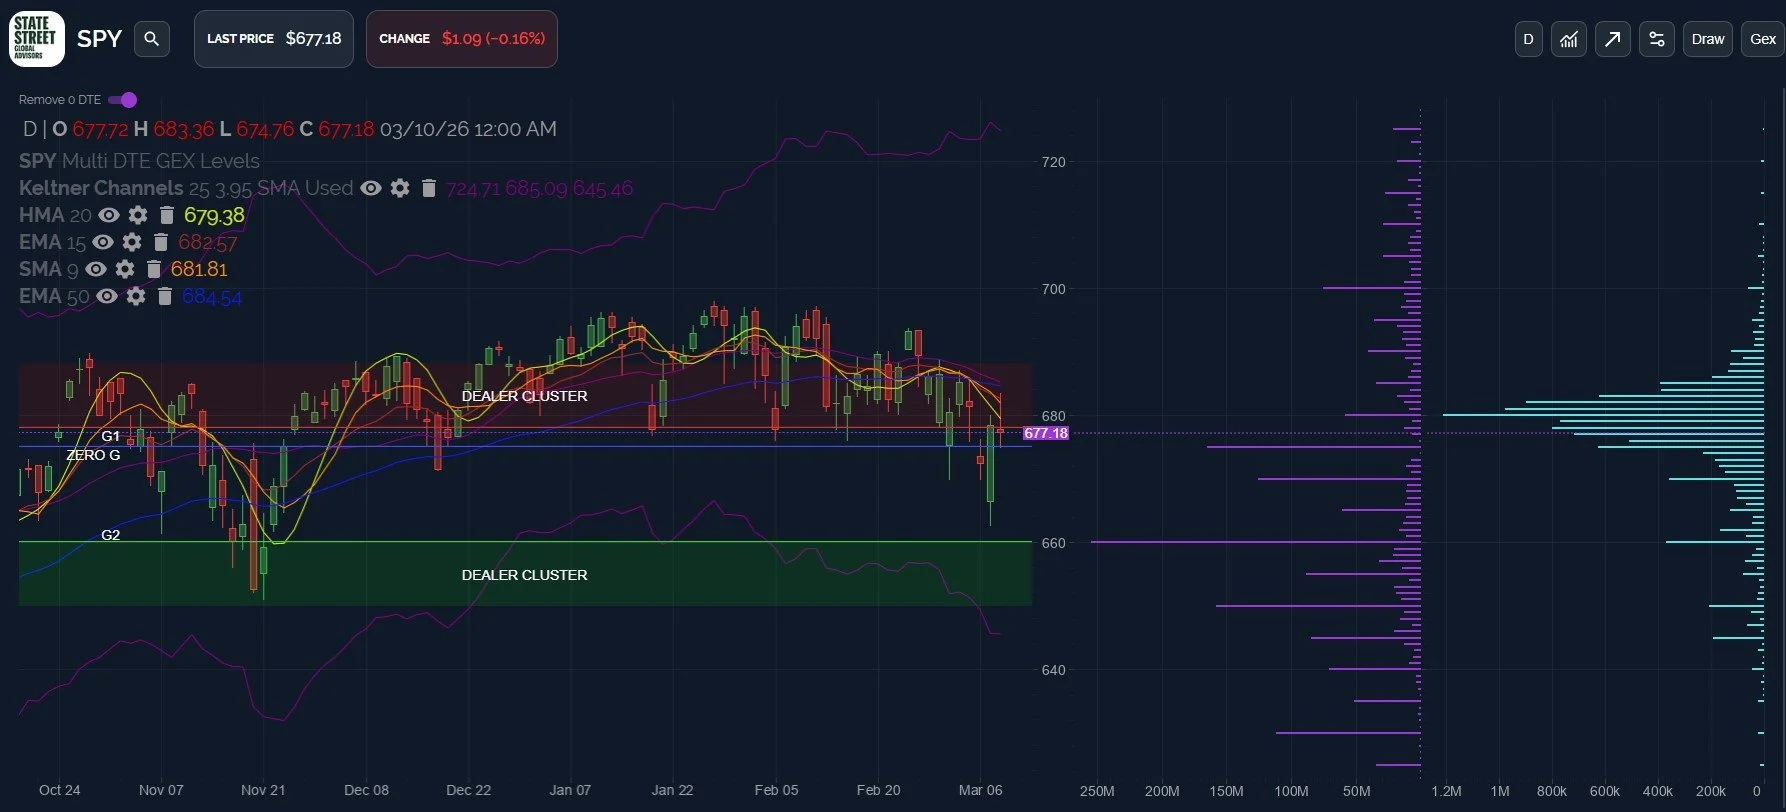
SPY remains below all of the moving averages on my daily chart, and those averages are pointing lower. We see a large GEX cluster at 660, representing a potential target in the event of another round of selling.
700 remains an upside target if we see 685 overtaken, so we want to watch action in the next few days as we approach OpEx week next week.
IWM also tested the HMA at 255.83, actually making it close to the 9 SMA with an intraday high of 257.65 before reversing. The candle wick looks bearish and we see very little interest above 260, both in terms of GEX and the light blue daily volume bars (excludes 0 DTE).
240-245 may be an interesting spot to reassess prospects for swing longs, in my opinion, so we’ll take a closer look if we get there.
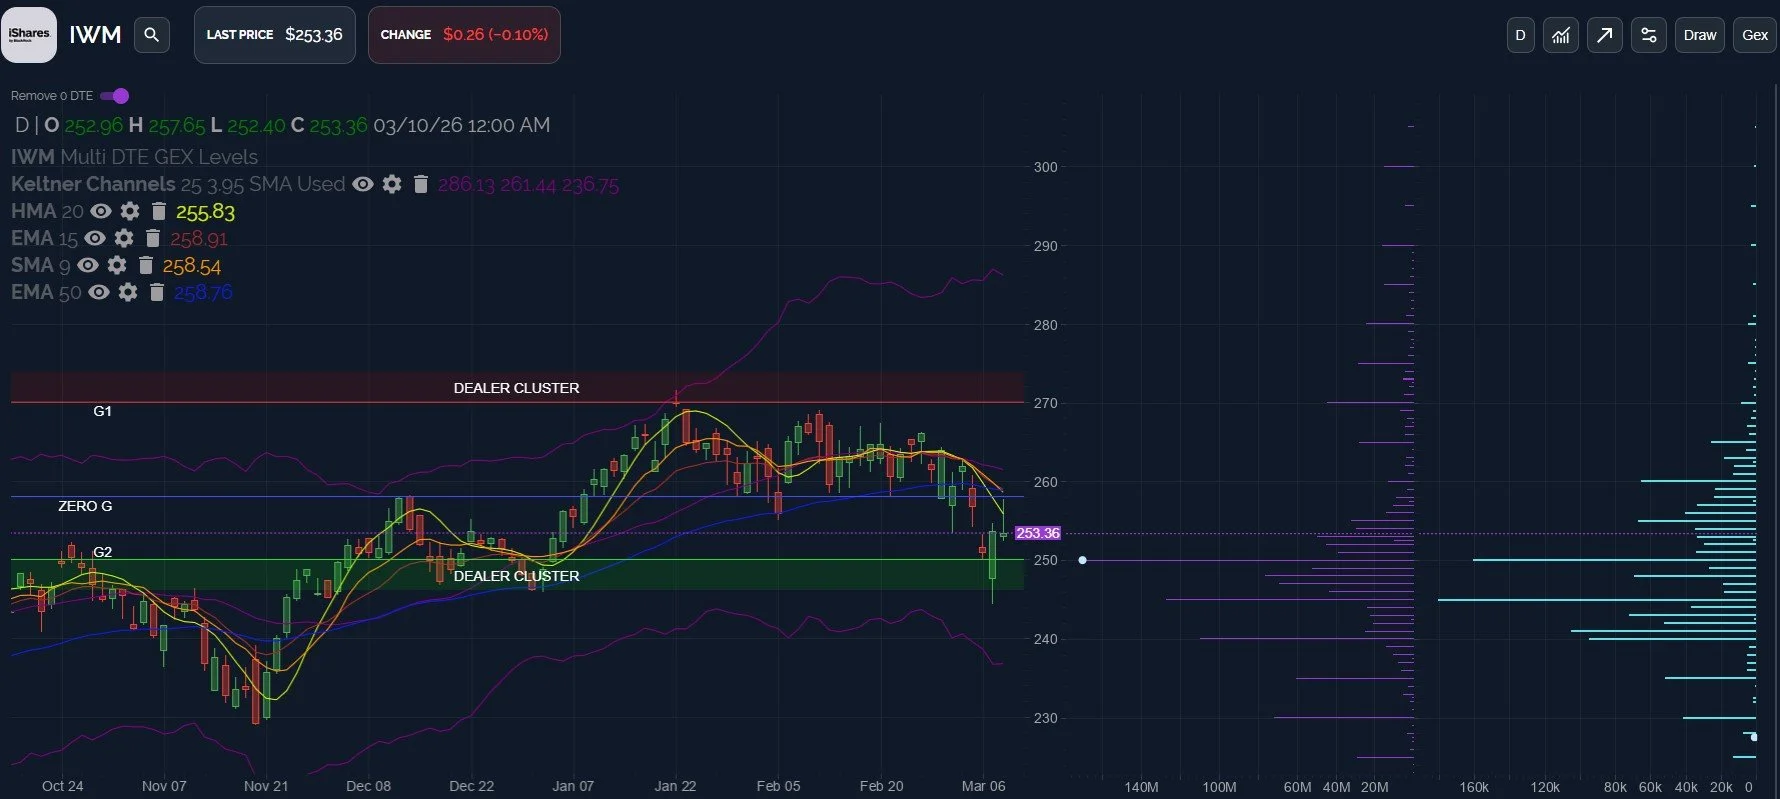
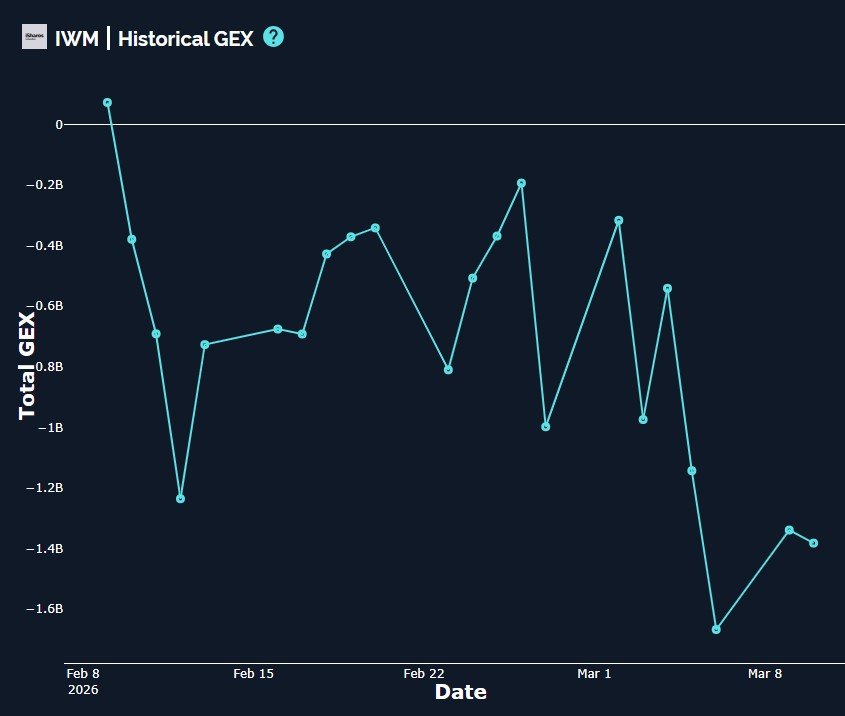
IWM net GEX decreased slightly, staying in negative territory.
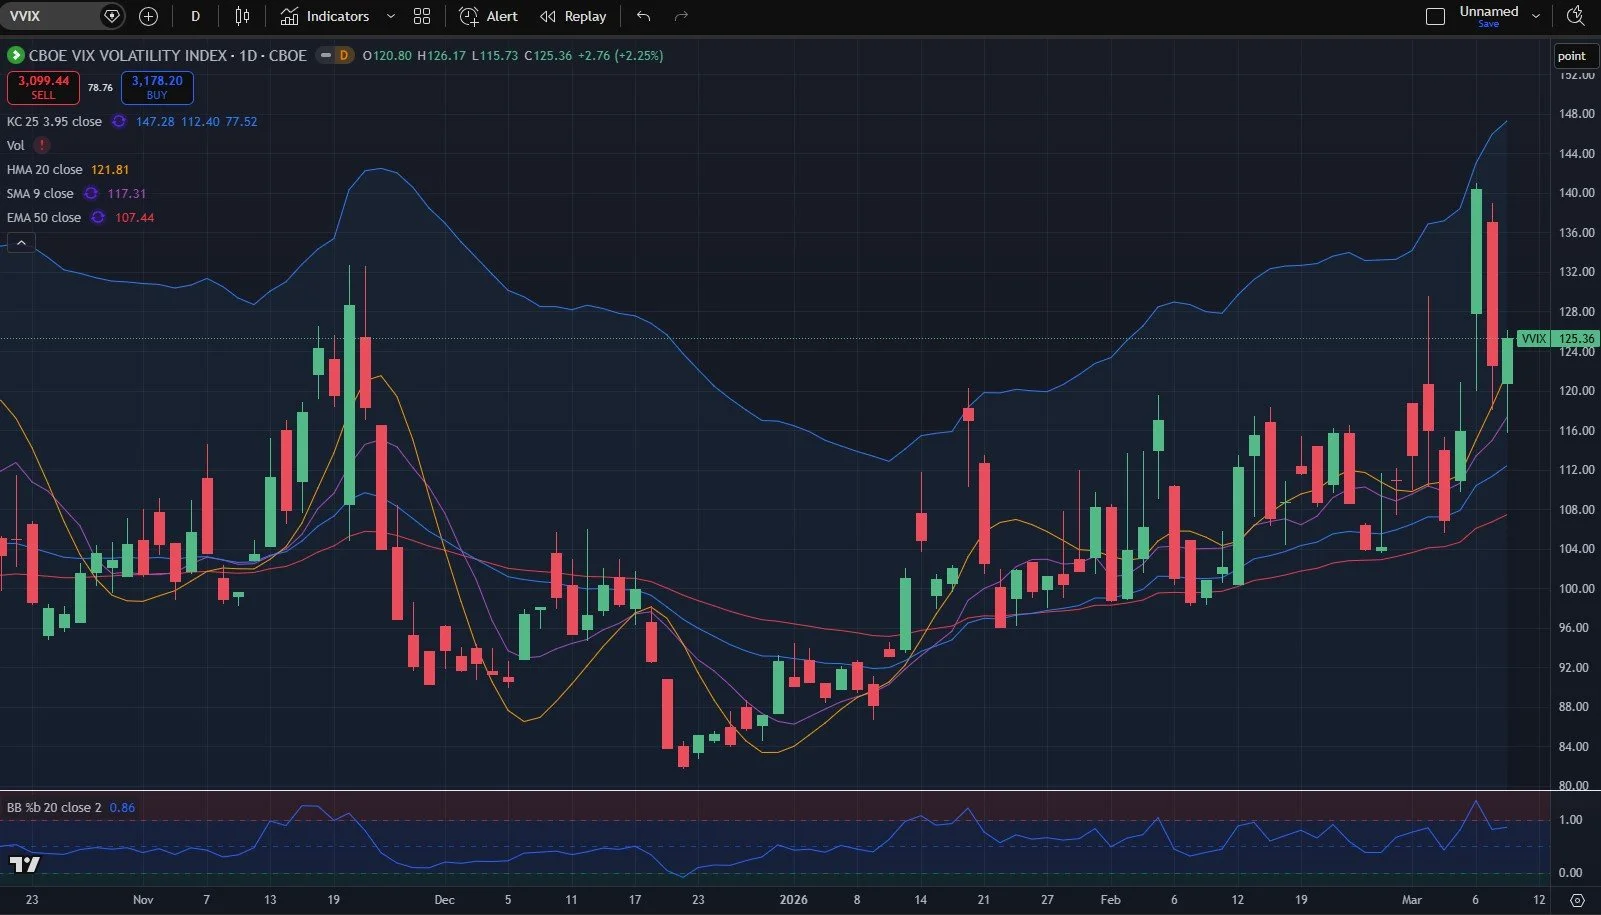
VVIX saw divergent performance relative to the VIX today, closing higher than yesterday’s close. VVIX is also above the HMA, and unless we really see the 50 EMA decisively broken, the chart looks to me like we might see another spike toward 150.
VVIX rising would imply the VIX also climbing, so we need to watch action in coming days.
Today’s decline in the VIX intraday tested key daily levels as well as levels on the 2-hour and 4-hour charts, all of which are holding up so far.
Index bulls might look for the VIX to lose 21.5 to signal a stronger rally, in my view, so we’ll be comparing the action we see with SPX other indices while also watching the VIX and VVIX.
GEX is still positive for the VIX, so volatility appears to be “buy-the-vol dip",” for now.
We hope you’ll join us in our livestream tomorrow as well as in Discord where we’ll share some observations of our own during the day.
To enter Discord as a non-subscriber, go to our homepage and click on Community to enter our Discord server! First-time guests receive a free 7-day trial of the premium Discord channels and this is where we discuss what’s happening in real-time.
We conduct a livestream that is accessible from our homepage every day around 10:30am ET, so feel free to join us there. You can also listen to our most recent livestream any time before the next day’s livestream occurs.
We’re still running an annual discount for the annual Portfolio Manager subscription, so enter SPRING2026 at checkout!
Thanks for being part of our community and know that we invite and appreciate your feedback!
The information provided by Geeks of Finance LLC is for educational purposes only and is not intended to be, nor should be construed as, an offer, recommendation or solicitation to buy or sell any security or instrument or to participate in any transaction or activity. Please view our Investment Adviser Disclaimer andRisk Disclosure.