
Intraday SPX Reversal: How Far Can We Drop? February 11 Stock Market Preview
Our $300 discount off of the annual Portfolio Manager subscription won’t last long, enter code WINTER2026 at checkout!
Monday’s YouTube video covers SPX, BTC, the VIX, SLV, and MSFT, so check it out by clicking Community at the top of our homepage to find the link to our YouTube channel!
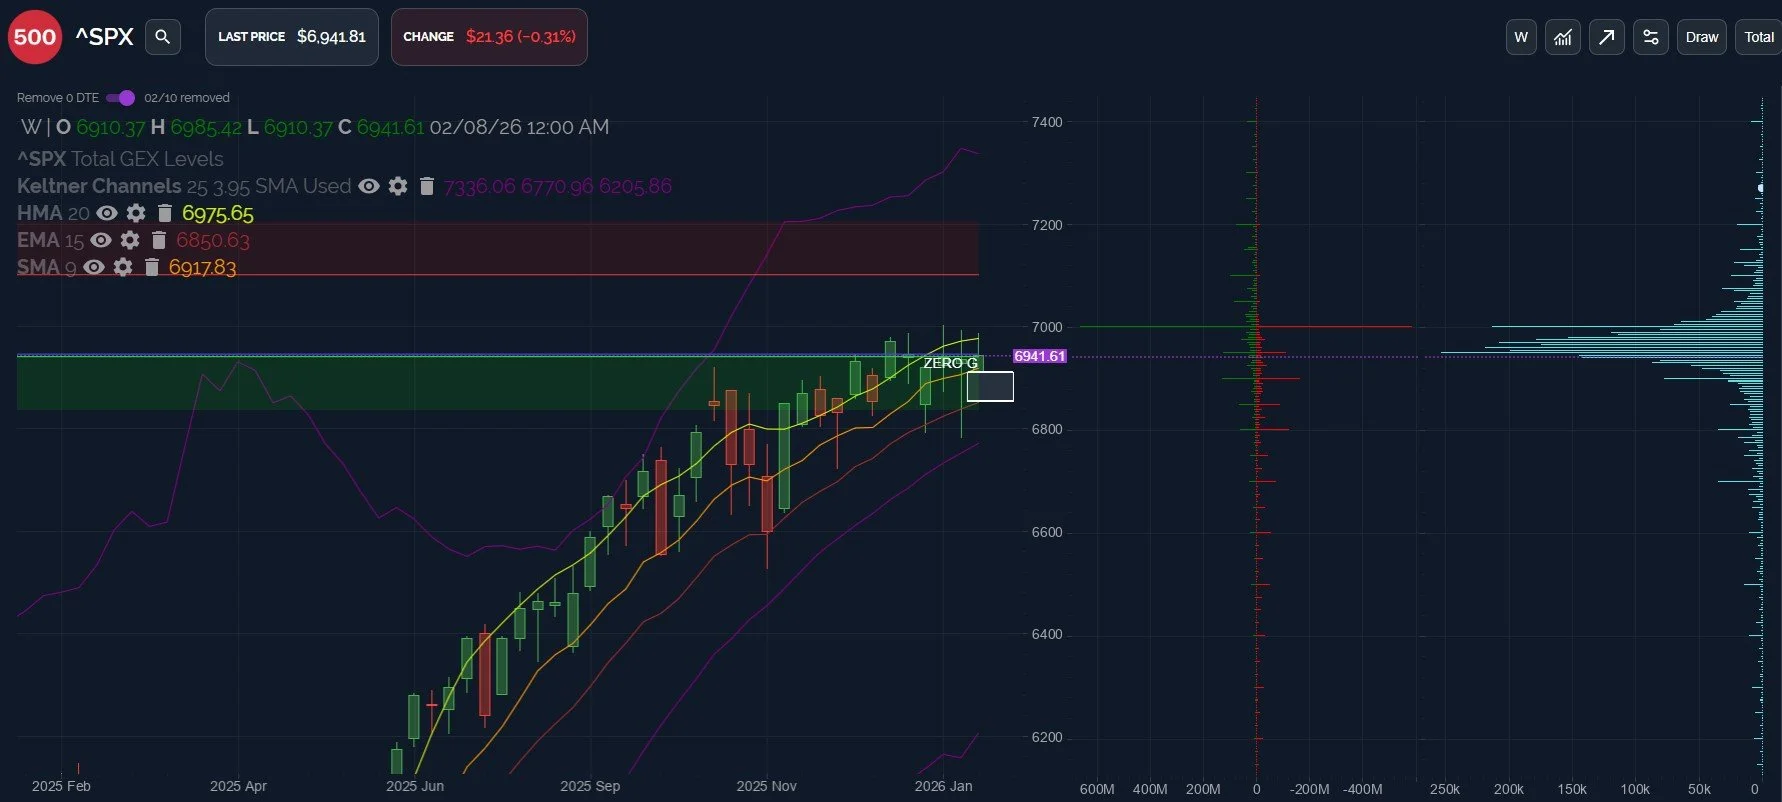
SPX exceeded yesterday’s high by 6 points, reaching 6985, but we saw a reversal intraday that ended up seeing SPX paint a red daily candle. This reversal fits with the primary scenario we outlined 2 days ago with an anticipated possible QQQ bounce to 615-620 before reversing lower.
SPX may decline to the daily Hull (HMA) at 6914 which is close to a large GEX cluster at 6900. Below that zone, we have to look to the weekly chart for technical levels that happen to correspond with the largest GEX areas we can see. 6850 is the 15 EMA, so any daily close below 6900 may target 6850.
The alternative (with potentially more bullish implications) would be a bounce from somewhere above 6914, and a close over 7000 would help as well. Let’s check some other index levels to watch simultaneously alongside SPX in hopes of narrowing down where we might reverse in the downside scenarios:
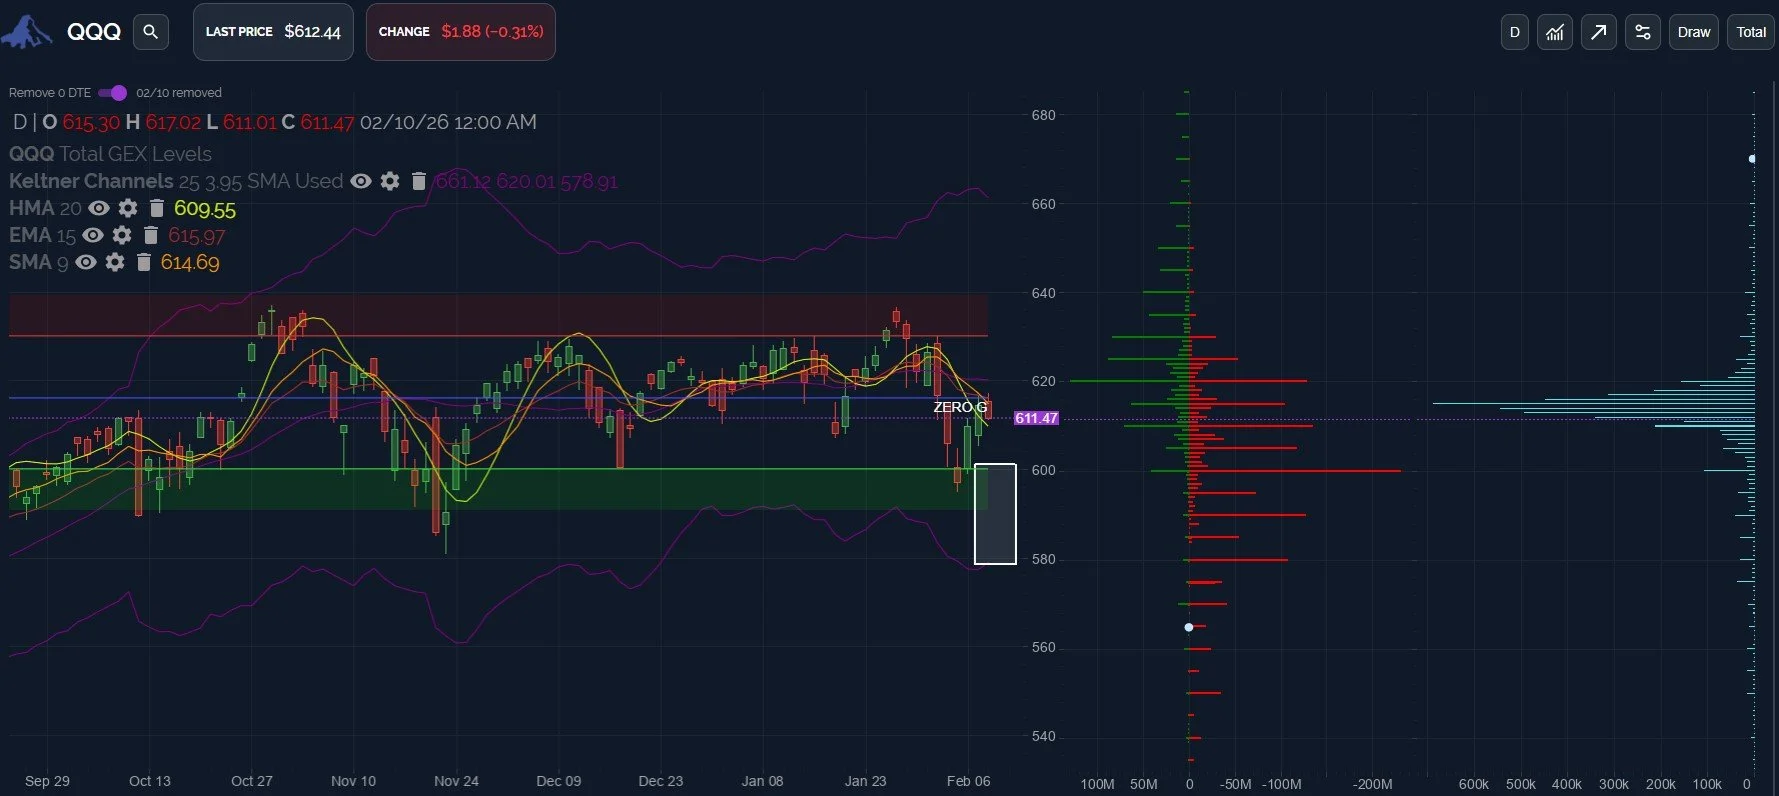
QQQ, the weakling of the group, rejected at the 9 SMA and now sits just 3 points above the HMA. If we see continuation below the 610 GEX cluster, which matches pretty well with the HMA, we can look at 600 again for potential support.
Any breach of 600 risks a new low toward the lower daily Keltner near the 580 GEX cluster, but the large relative amount of GEX at 600 likely means we could see a successful retest that holds, or at least we know the significance of a breach if one does occur at 600.
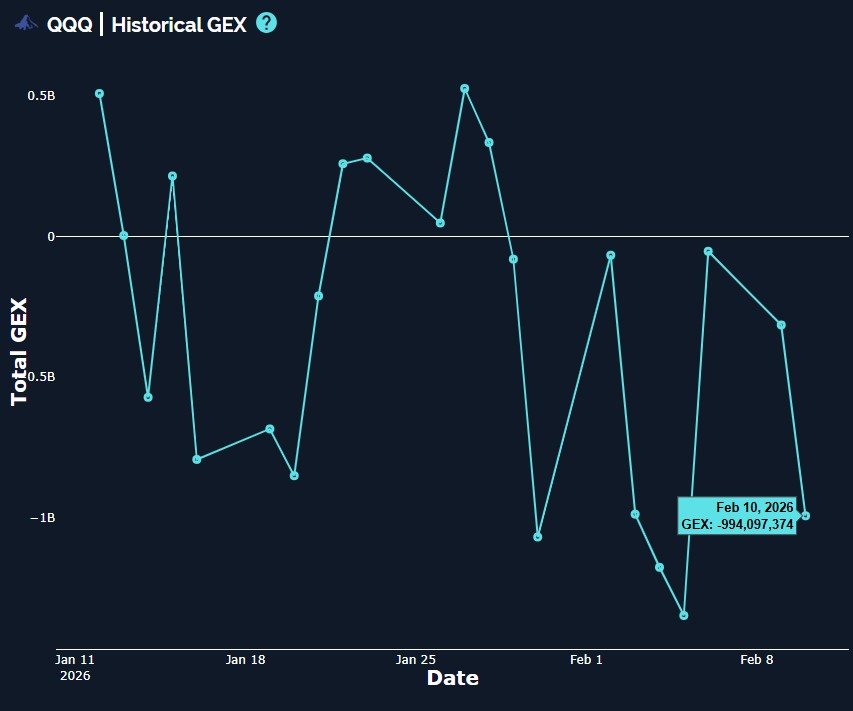
QQQ’s net GEX continues to paint an uninspiring picture, diving deeper into negative territory. While price action over the last few months has ultimately been sideways, GEX has been trending more negative as we get into February, not a sign I want to see personally if I’m looking to get bullish on tech.
An extreme negative GEX reading may be a good contrarian signal, but otherwise, I’d prefer to see GEX begin moving steadily higher to signal more bullish times ahead.
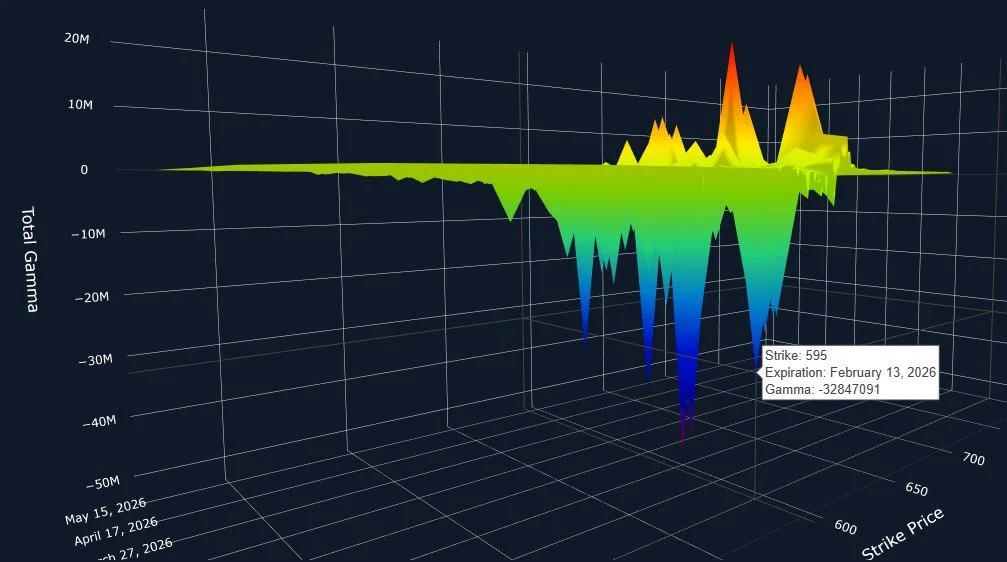
Furthermore, looking at QQQ’s 3D graph, we see the largest net GEX clusters at 595-607 expiring this Friday, exceeding the positive GEX clusters at the same expiration. This disparity potentially implies some downside action (or back and forth) as opposed to a runaway bullish move into the end of the week before OpEx week.
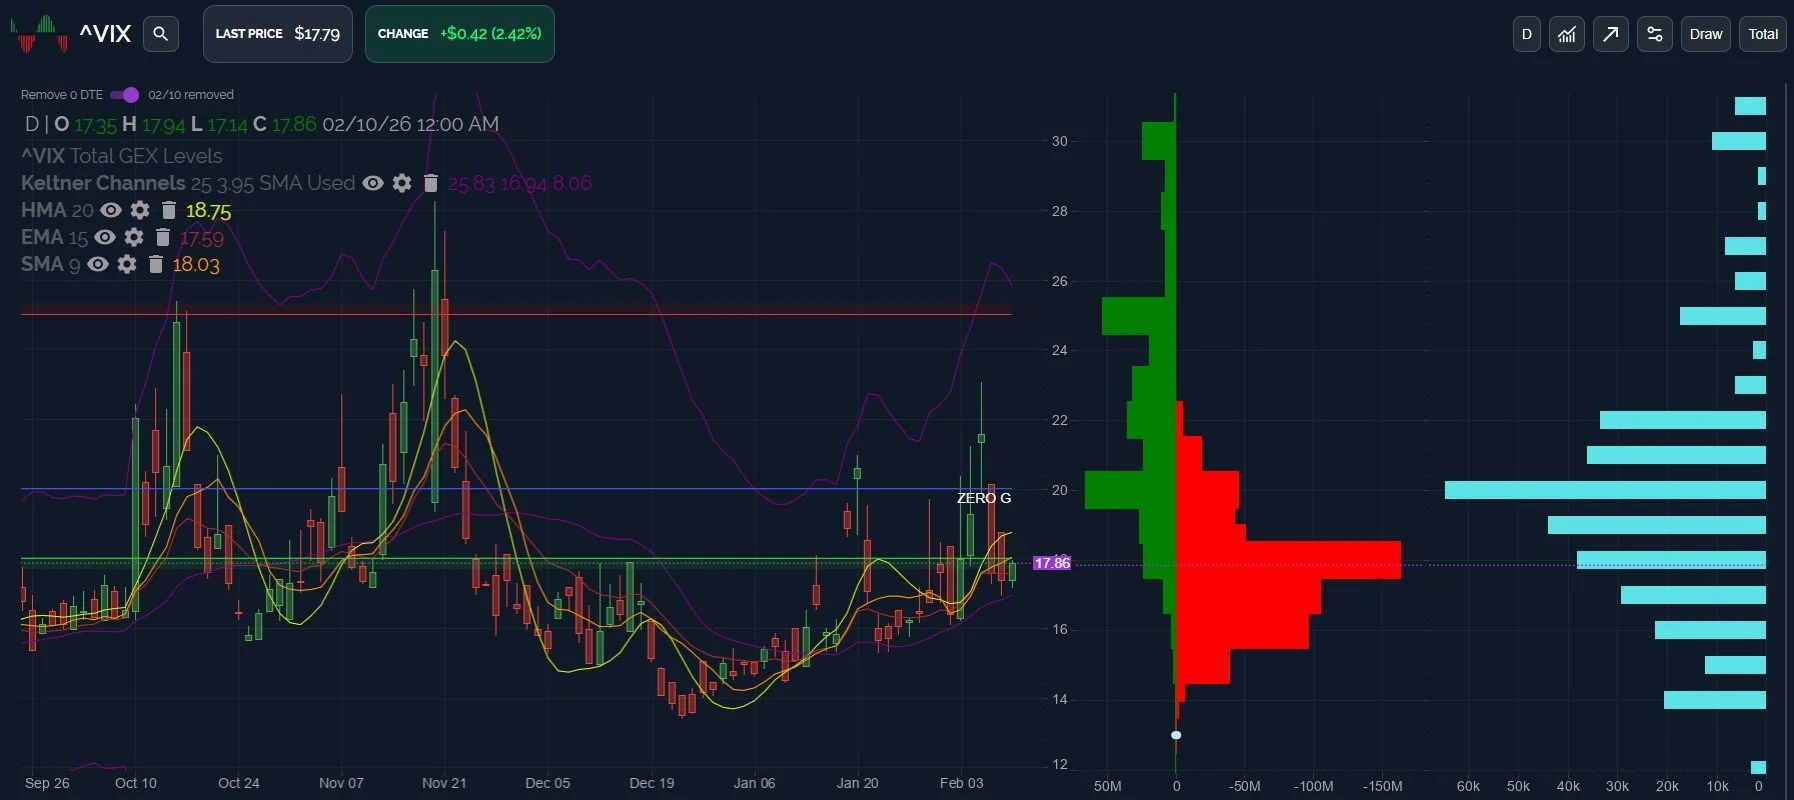
The VIX also bounced right where we wanted to see it bounce, holding the upward trend we can see stretching back to December. The bounce stopped shy of the 9-period SMA, and the HMA is closer to 19, an area we’ll watch if the VIX rebound continues.
Ultimately, the VIX failing anywhere from here to the 20 mark is likely bullish, but the risk is an overshoot toward the upper Dealer Cluster zone at 25.
Alternatively, if we see the VIX close below 16.93, we may see a more significant market move higher and the VIX returning to the 14-15 range.
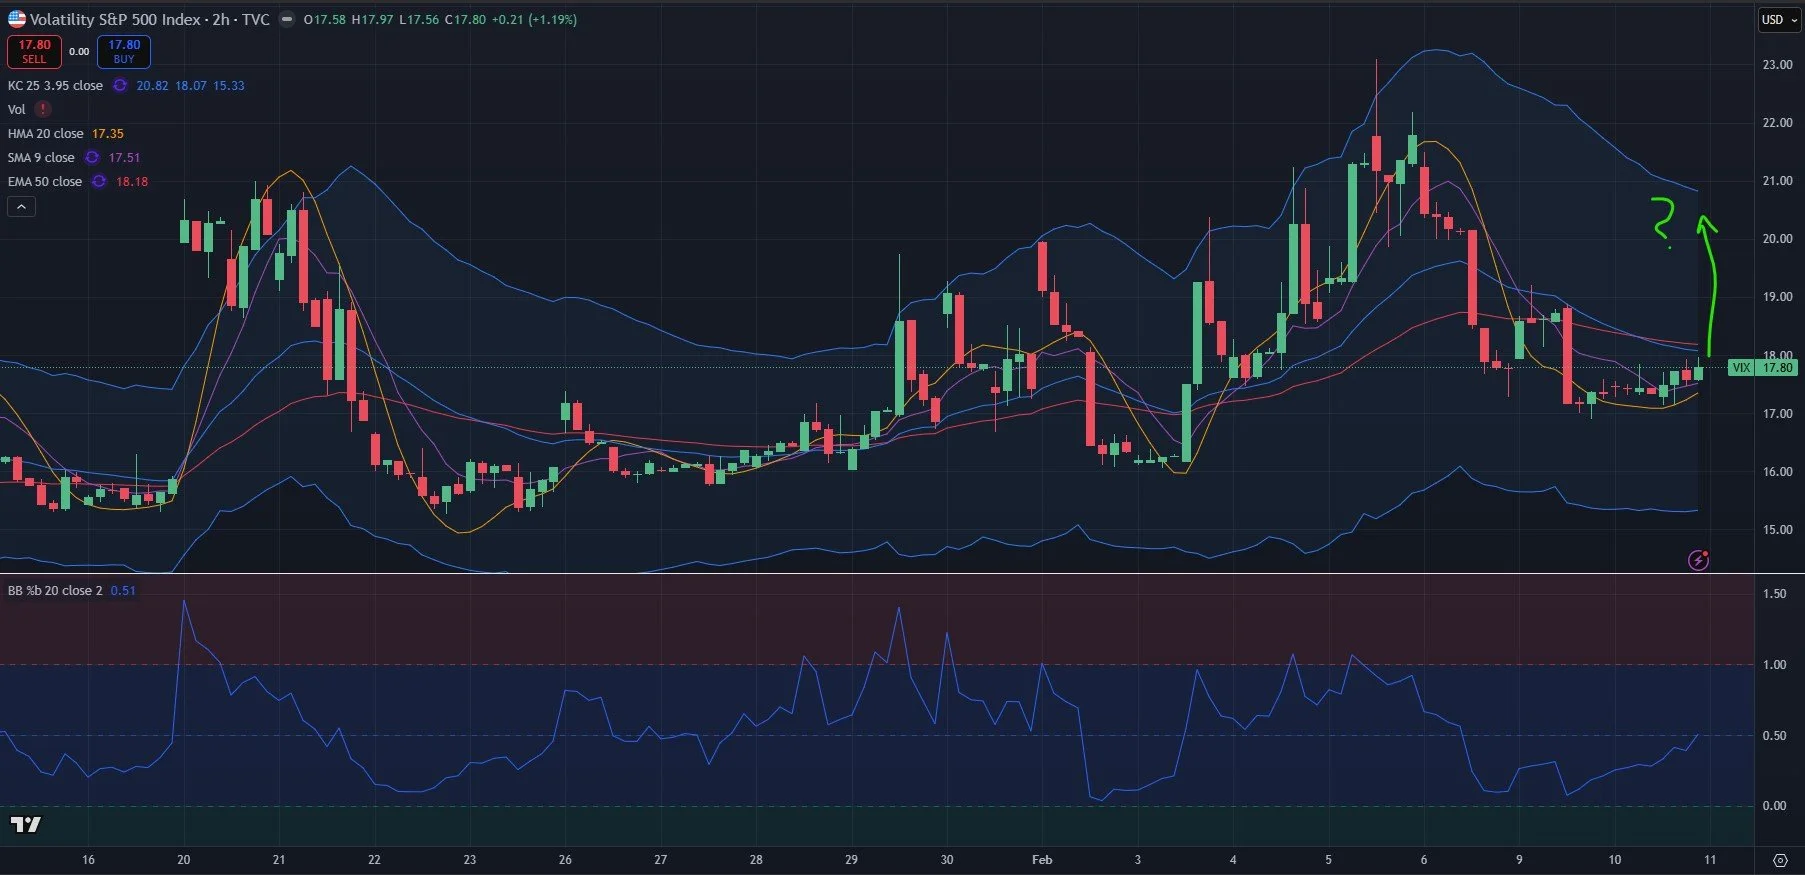
The VIX 2-hour chart seems to validate potential for a VIX spike, with the VIX staying above the HMA at 17.35.
Any spike beyond the resistance at 18 may take the VIX toward 20-21, which brings us back to then watching for potential rejection or continuation at that level.
With OpEx next week, and monthly VIX options expiring a week from Wednesday, we could see a whipsaw in both directions, and keep in mind the last 3 OpEx weeks saw a downward bias for part or all of the week.
As always, we will revisit the total picture as we approach the cash session in the morning.
We hope you’ll join us in Discord, where we interact and share ideas day-to-day. Thanks for reading!
To enter Discord as a non-subscriber, go to our homepage and click on Community to enter our Discord server! First-time guests receive a free 7-day trial of the premium Discord channels and this is where we discuss what’s happening in real-time.
We also have a live stream accessible from our homepage every day around 10:30am ET, so feel free to join us there.
We are currently offering an annual discount for the Portfolio Manager subscription, so check out the first paragraph of this newsletter for more info!
Thanks for being part of our community and know that we invite and appreciate your feedback!
The information provided by Geeks of Finance LLC is for educational purposes only and is not intended to be, nor should be construed as, an offer, recommendation or solicitation to buy or sell any security or instrument or to participate in any transaction or activity. Please view our Investment Adviser Disclaimer and Risk Disclosure.