
Increasing Risk Of A Pullback? November 4 Stock Market Preview
PORTFOLIO MANAGER ANNUAL SUBSCRIPTION PROMO- $300 off of the annual Portfolio Manager subscription Enter code FALL2025 at checkout! ENDING SOON!
Check out tonight’s YouTube video if you have a few minutes; we cover the broader market (including QQQ, not covered in tonight’s newsletter) as well as a variety of individual tickers!
SPX continues to diddle around this gap area from 10/27, when traders decided over that weekend that a 40% gain since April didn’t price in enough, we needed to break out from that point to begin pricing in..Well, something that hasn’t already been known for at least a few years, I guess.
Joking aside, we have 3 days of SPX closing below the Hull Moving Average on the daily chart, though the Hull is rising, and the general trend higher still favors a break toward the upside.
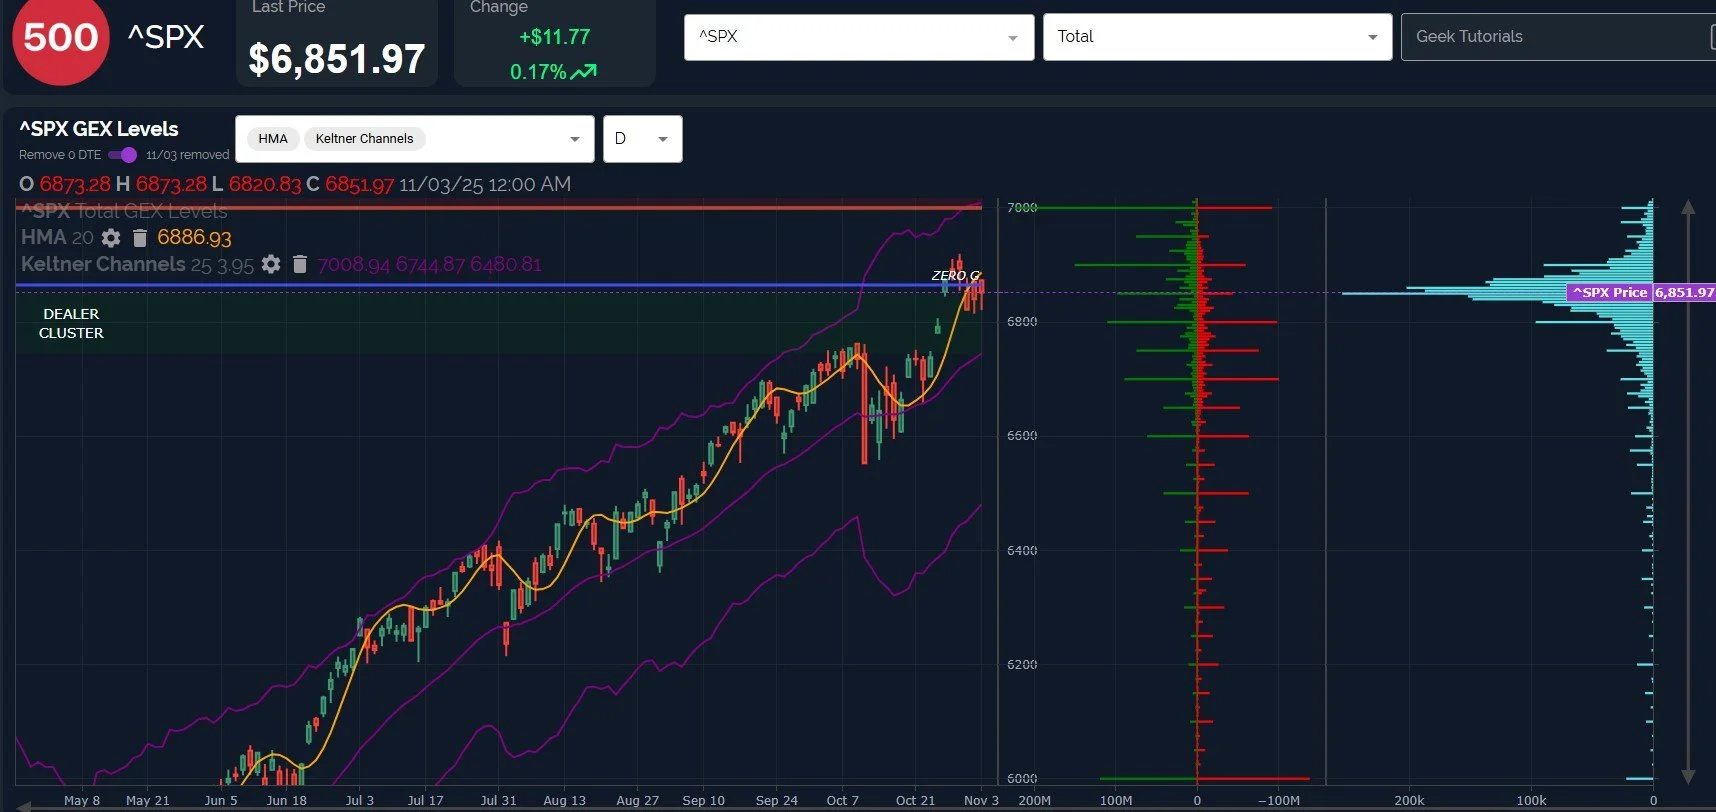
We do have a noteworthy conflict to the upside scenario: We just saw the 7000 GEX that we recently noted as being concentrated at the 11/21 expiration moving back toward mid-December, now overtaken by lower strikes.
Ultimately, SPX bears don’t have a shot above 6800 SPX, at least until 7000 is tagged, at which point a reassessment of the GEX picture is in order.
IWM’s Hull has already turned lower, creating a downtrend line similar to mid-September that bulls will need to overcome. 245 is now an important line-in-the-sand, with 240 as a possible ultimate target below.
Any further declines to IWM 240 may mark a nice buying opportunity, if such declines hold. 250 remains the largest net positive GEX cluster, so IWM holding above 247.46 makes 250 a much higher likelihood.
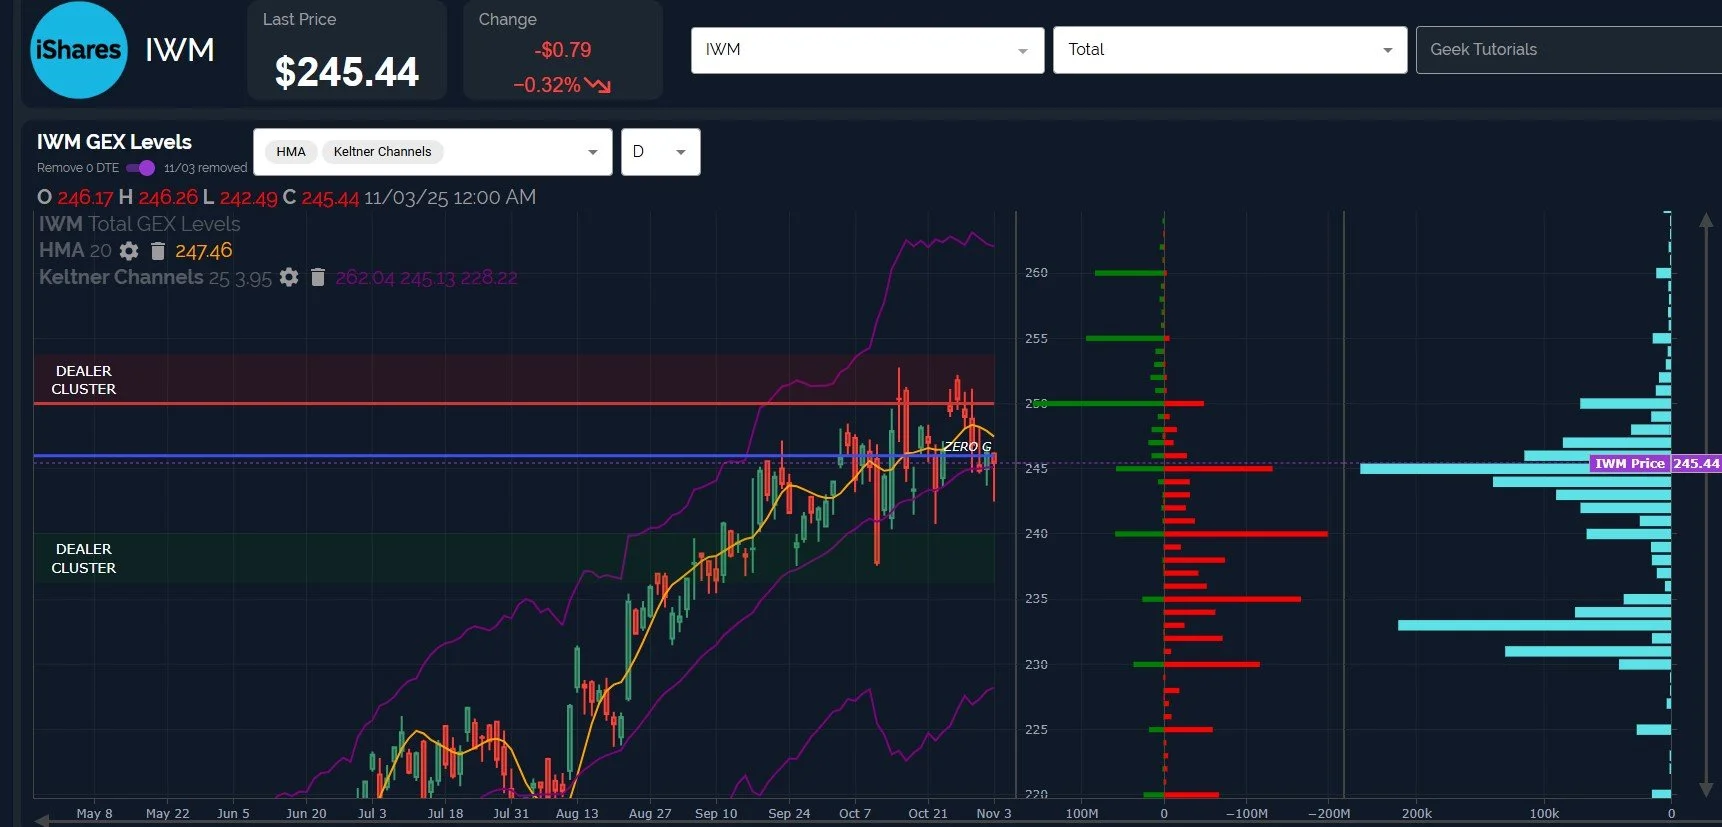
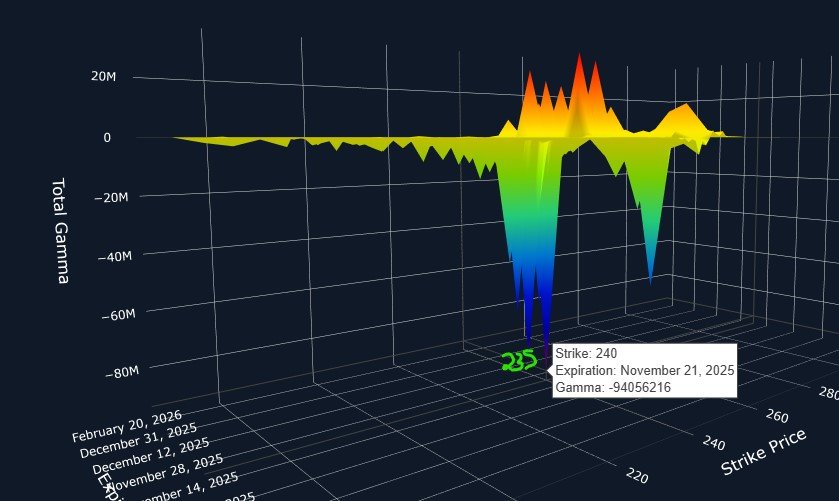
IWM still appears to be the most bearish of the three, spending multiple days below the Hull, and net Negative GEX on IWM gives us a few realistic targets in coming weeks. 235-240 appear to be good targets for November 21, according to what is seen at those strikes.
Alright, so we see some concerning signals from the indices. What about the VIX?
While the VIX shows a generally rising trend since late-October, and a higher high in November, the last 3 days have left the VIX below the trend line and below the 4-hour Hull, ultimately.
We do see room below toward VIX 15.5-16, if 17.70 isn’t recaptured.
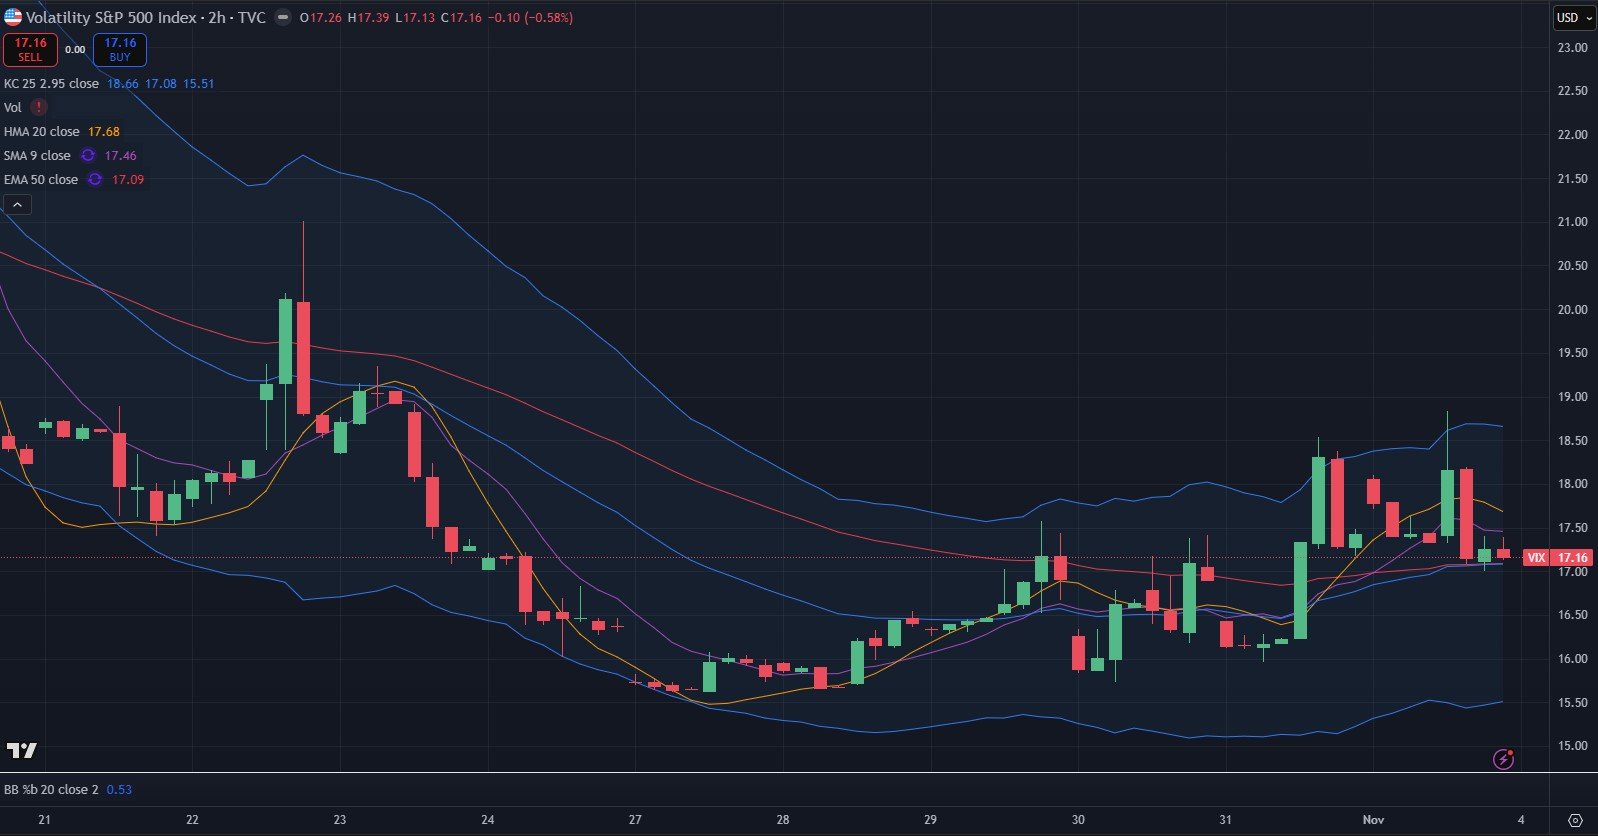
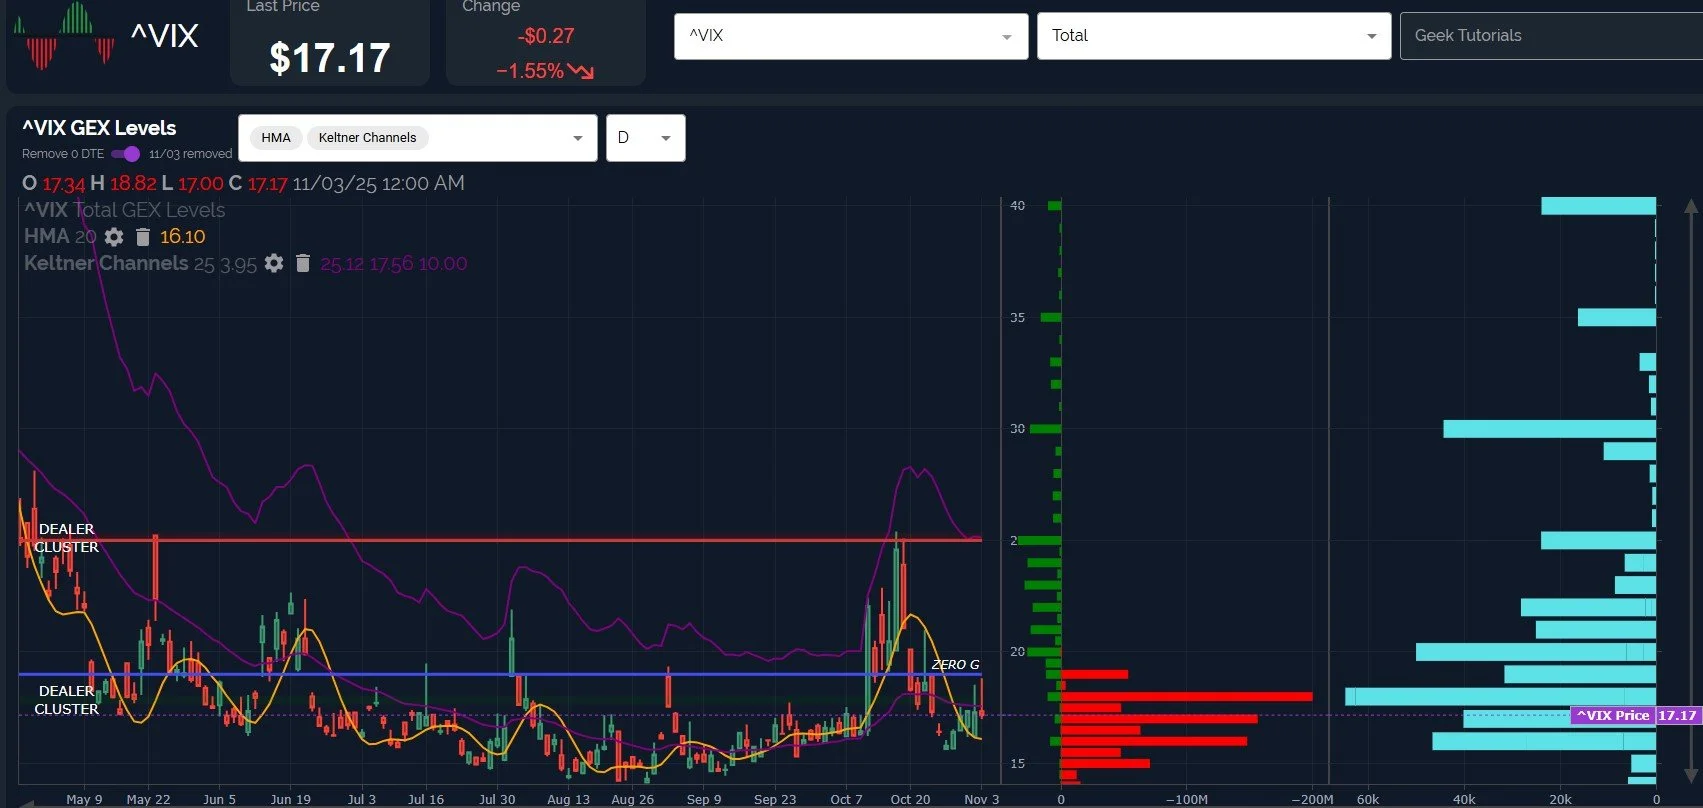
Looking at the VIX daily chart, we see the Hull (the yellow line) starting to flatten, but not yet turning higher.
This presents an opportunity for the VIX to either drop toward the 16.1 area, or rally toward 20-25 or beyond, dragging the Hull upward with it.
Negative GEX at 16-18 potentially implies a squeeze move above 18, if the VIX can hold above that level.
We WON’T be conducting the live stream tomorrow, but we’ll be posting extra in Discord, so we hope you join us! The live stream will resume later on this week!
Here’s the link to our Discord server if you haven’t joined us yet! We have an active community of thoughtful and experienced traders who chime in throughout the day, and several channels dedicated to intraday and weekly trading.
You can join our discussion every day when we discuss markets in real-time via our Geeks Live livestream, now available to everyone for free via the homepage!
If you’re interested in accessing our tools and analytics, be sure to check out our website! We have a lot of updates in the works, and we have 2 primary membership tiers that you can read more about by clicking here: All About Our Memberships
If you’re interested in learning more about our strategy and approach, we address all of these topics in our Geek University course which is included in all memberships.
We posted a YouTube video today, and we have useful and educational playlists, so give our channel a look if you’re curious about recent market commentary and ideas as well as gamma (GEX) concepts explained.
Thanks for being part of our community and know that we invite your feedback!
The information provided by Geeks of Finance LLC is for educational purposes only and is not intended to be, nor should be construed as, an offer, recommendation or solicitation to buy or sell any security or instrument or to participate in any transaction or activity. Please view our Investment Adviser Disclaimer and Risk Disclosure.