
Bears Already Giving Up? October 20 Stock Market Preview
NEW PORTFOLIO MANAGER ANNUAL SUBSCRIPTION PROMO- $300 off of the annual Portfolio Manager subscription Enter coude FALL2025 at checkout!
Here’s the link to tonight’s YouTube video, if you have a few minutes to hear some complementary ideas on individual tickers and additional analysis of indices.
To summarize where we closed as of Friday:
IWM had the most bearish close amongst indices based on key technical indicators as well as remaining in negative GEX territory.
SPX looks bearish on the weekly but slightly bullish on the daily chart.
QQQ looks the most bullish.
The VIX and VVIX saw a bearish (for volatility) reversal Friday, though the close saw both remaining just below key daily Hull support after a big red candle.
Given these seemingly conflicting factors, we remain indecisive regarding continuation of the decline or a resumption of the previous uptrend, though Wayne Whaley on x.com points out that when the trailing quarter to October 18-27 sees performance of 3.3% or greater (17 instances of the previous 51 years, which we have now), the S&P was only positive 3 times, while negative 14 times. So the odds this week do not favor bulls.

Let’s look at the VIX weekly chart above for another potentially impactful data point (though with a very small sample): The last 3 times we saw the weekly Hull Moving Average cross the 9-period SMA, the VIX spiked beyond the initial crossover, which appears to be just happening as of last week’s close.
The VIX and VVIX daily charts (neither of which are included in tonight’s newsletter) show Friday’s powerful reversal dropping both indices just below the key Hull, though close enough to make another reversal higher completely possible.
GEX is positive for the VIX, which is unusual, and we have the monthly VIX options expiring Wednesday premarket, so we may see some interesting moves leading into Wednesday or immediately thereafter.

IWM’s daily and weekly charts show a close below the Hull, which maintains a bearish bias, though the daily candle can be interpreted as a reversal candle.
Net GEX remains negative for IWM, and the long candle wick on the weekly chart below may indicate eager selling amongst participants, so we need to be wary of the risks at this juncture for IWM.
A better tactical long entry might be with a daily close above 246, targeting anywhere from 260-270 assuming the current GEX picture.
Volume continues to be very elevated every daty at 230-235, though we can’t draw definitive conclusions from that.
Note that we show total net GEX clusters on the daily chart, while displaying total gross GEX on the weekly chart, though both are interchangeable on any chart timeframe for subscribers, ranging from 0 DTE to weekly to total.

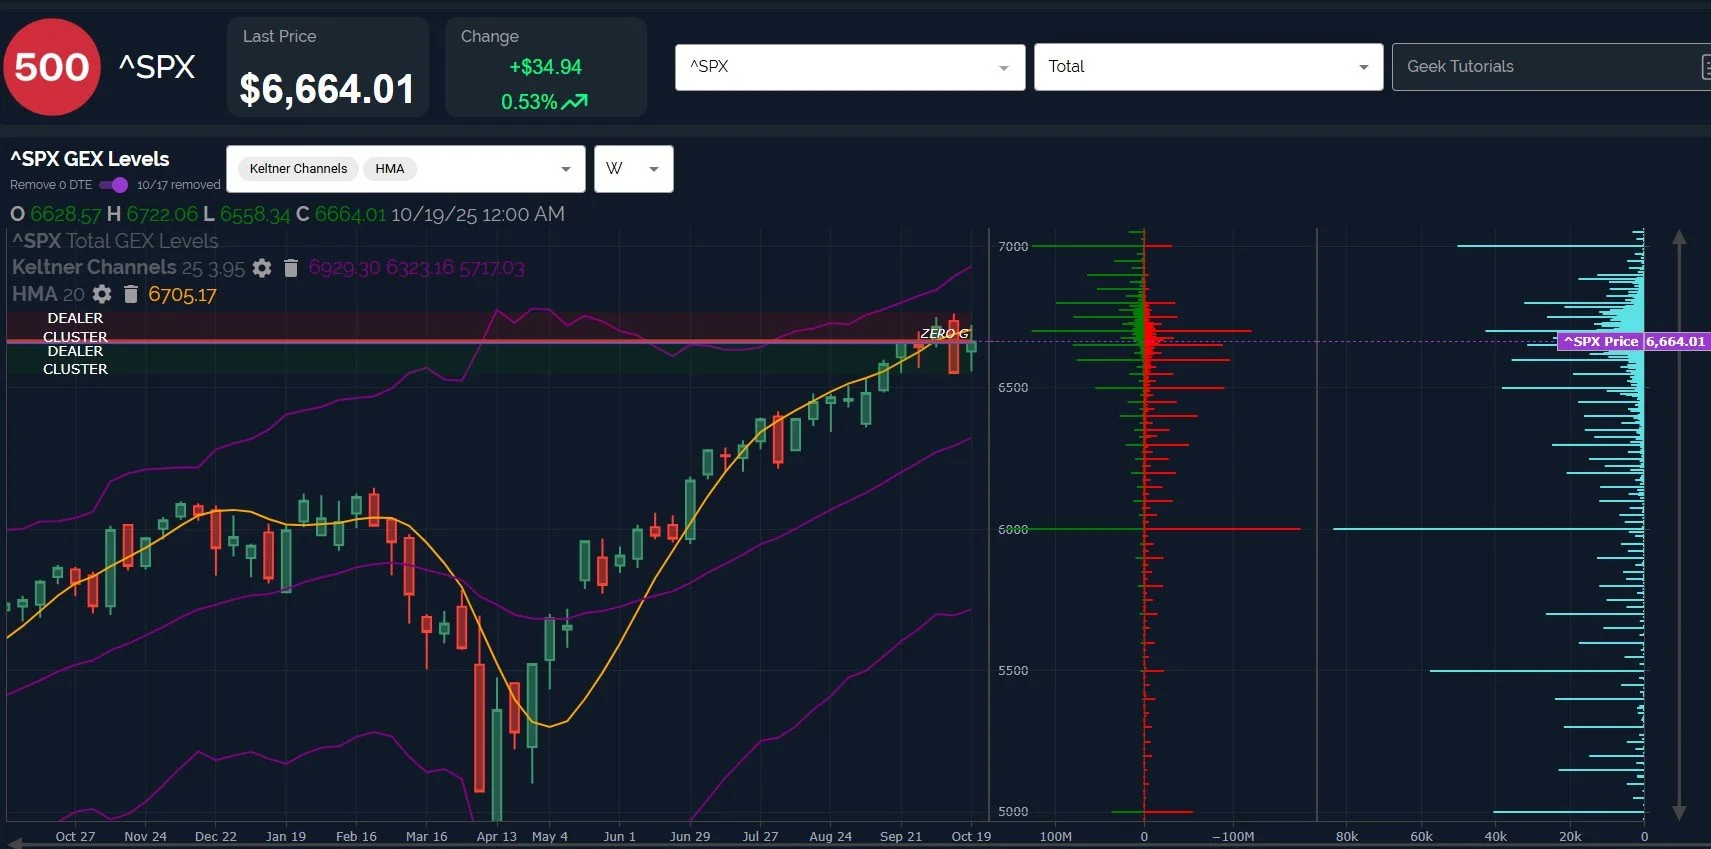
SPX’s daily chart (also showing net GEX) looks slightly bullish as of Friday, with a tightening triangle forming and a close just above the key Hull. 7000 remains as the largest net GEX cluster, which is bullish, though most of that GEX resides at 12/31/25 and 1/16/26.
It’s been quite some time since I’ve seen so much volume at a variety of strikes between 5000 and 6000.

SPX’s weekly chart, which has gross GEX toggled, shows a close below the weekly Hull for the 2nd week in a row.
Positive and negative GEX at 6700 in meaningful quantity reveal the importance of that level for participants.
Remaining below 6700 opens the door to 6500 and possibly even 6000, so the action around this area is very important.
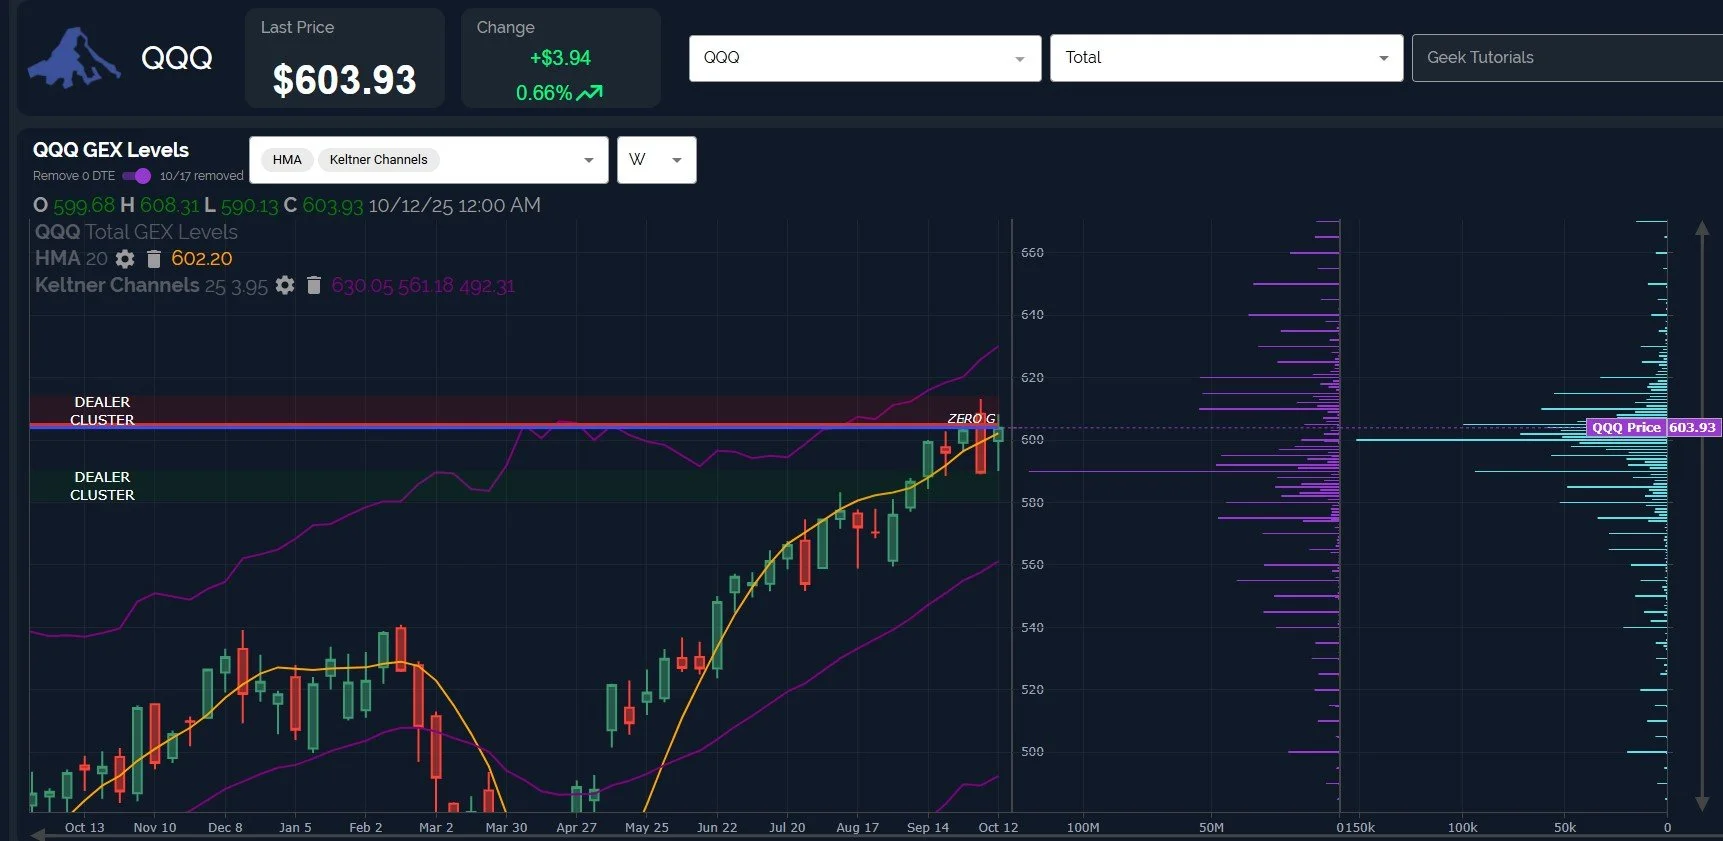
QQQ looks very similar to SPX on a daily timeframe, but QQQ’s weekly chart looks a little more bullish, with QQQ closing above the weekly Hull.
The GEX picture remains barely positive, with 590 appearing as the current most significant net GEX cluster.
QQQ can really go either way at the moment, though I would expect IWM’s decision to logically drag QQQ and SPX along with it toward the upside or downside in coming weeks. We will continue watching the QQQ 602 area and then 600 for clues as to what comes next.
Here’s the link to our Discord server if you haven’t joined us yet! We have an active community of thoughtful and experienced traders who chime in throughout the day, and several channels dedicated to intraday and weekly trading.
You can join our discussion every day when we discuss markets in real-time via our Geeks Live livestream, now available to everyone for free via the homepage!
If you’re interested in accessing our tools and analytics, be sure to check out our website! We have a lot of updates in the works, and we have 2 primary membership tiers that you can read more about by clicking here: All About Our Memberships
If you’re interested in learning more about our strategy and approach, we address all of these topics in our Geek University course which is included in all memberships.
We posted a YouTube video today, as mentioned at the beginning of the newsletter, and we have useful and educational playlists, so give our channel a look if you’re curious about recent market commentary and ideas as well as gamma (GEX) concepts explained.
Thanks for being part of our community and know that we invite your feedback!
The information provided by Geeks of Finance LLC is for educational purposes only and is not intended to be, nor should be construed as, an offer, recommendation or solicitation to buy or sell any security or instrument or to participate in any transaction or activity. Please view our Investment Adviser Disclaimer and Risk Disclosure.