
Diamonds For Dummies?
We got our bounce we were looking for this morning, which was nice to see. Unfortunately, so far it doesn’t seem to have lasted very long, but anyone who caught the bounce could have managed risk and made today a profitable one regardless of the bounces sustainability.
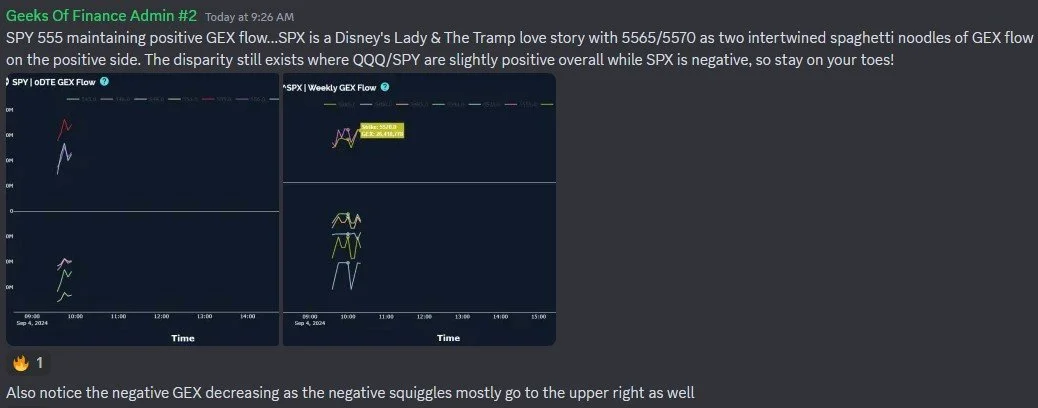
In Discord, we noted that gamma (GEX) gave us a heads up well in advance, which we shared for free. This confidence came from both the 0 DTE GEX positioning as well as observing GEX flow as the morning progressed. We also caught a large chunk of the move down, once GEX shifted and gave us some visibility in the afternoon. Here’s actually the 2nd post we made in Discord highlighting the attention we saw on SPY 555 and SPX 5565 (also QQQ 462):
We don’t have too much to add regarding our commentary on SPY and QQQ right now, but we do want to take a look at how these indices compare to the Dow Jones (DIA), also called the “Diamonds.” My view is inherently subjective, but using my indicators, the chart looks the most bullish of the various indices, with the Keltner channels in a fairly steep uptrend since May in particular.
This may bode well in the intermediate to longer term, similar to our view on IWM going into the last quarter of the year, but we also can’t ignore some signs that perhaps a deeper short term pullback may occur. I notice the price is below the Hull Moving Average, for instance, one of my signals to look toward the short side as having higher odds. If DIA continues lower, we can drop 1.5% and still stop at solid support for another leg higher, so it’s still too early to get TOO bearish, in my view.
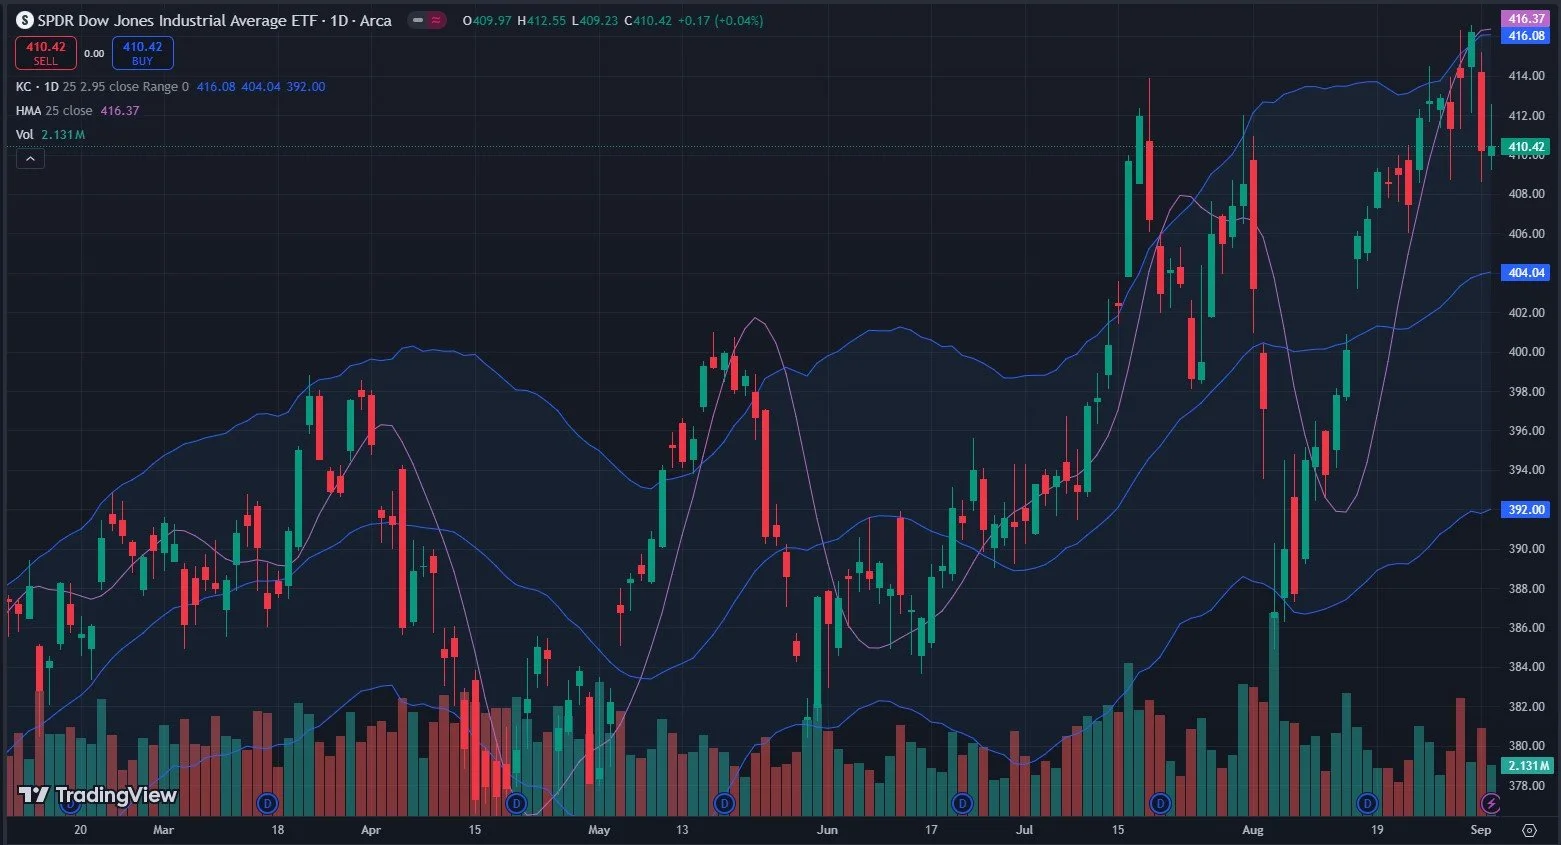
DIA Chart: TradingView.com
Why does DIA appear to be different from QQQ and SPY? We really don’t need to look further than the top 10 holdings, which are extremely light on the technology side relative to QQQ and SPY, which have 80% overlap amongst their top 10 holdings and most of which are in the tech sector. Healthcare, industrials, some retail, and financials make up a sizable chunk of the top 10 for DIA.

Source: Yahoo!Finance
GEX also appears more positive than SPY or QQQ, with DIA showing slightly positive overall GEX compared to a far more negative GEX picture for SPY and QQQ. That said, 23.7M is still technically neutral, so we can’t pretend DIA is headed straight to the moon. Perhaps it is, but we don’t see anything to back that view.
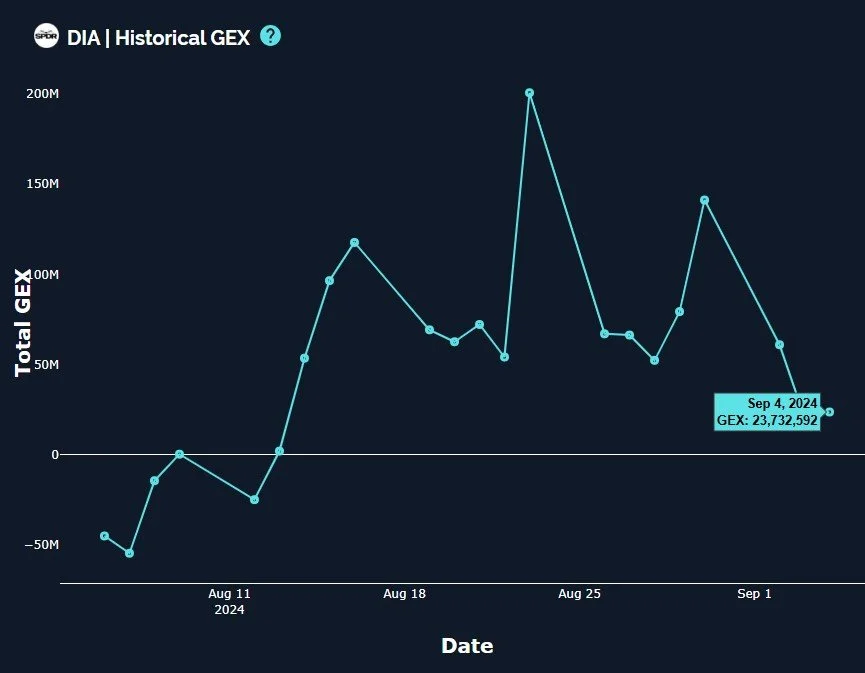
DIA Historical GEX: www.geeksoffinance.com
DIA’s largest positive GEX clusters are at 415 and 420, with 420 being the largest. These clusters are scattered throughout September, with September 20 representing the largest cluster for most of the positive strikes.
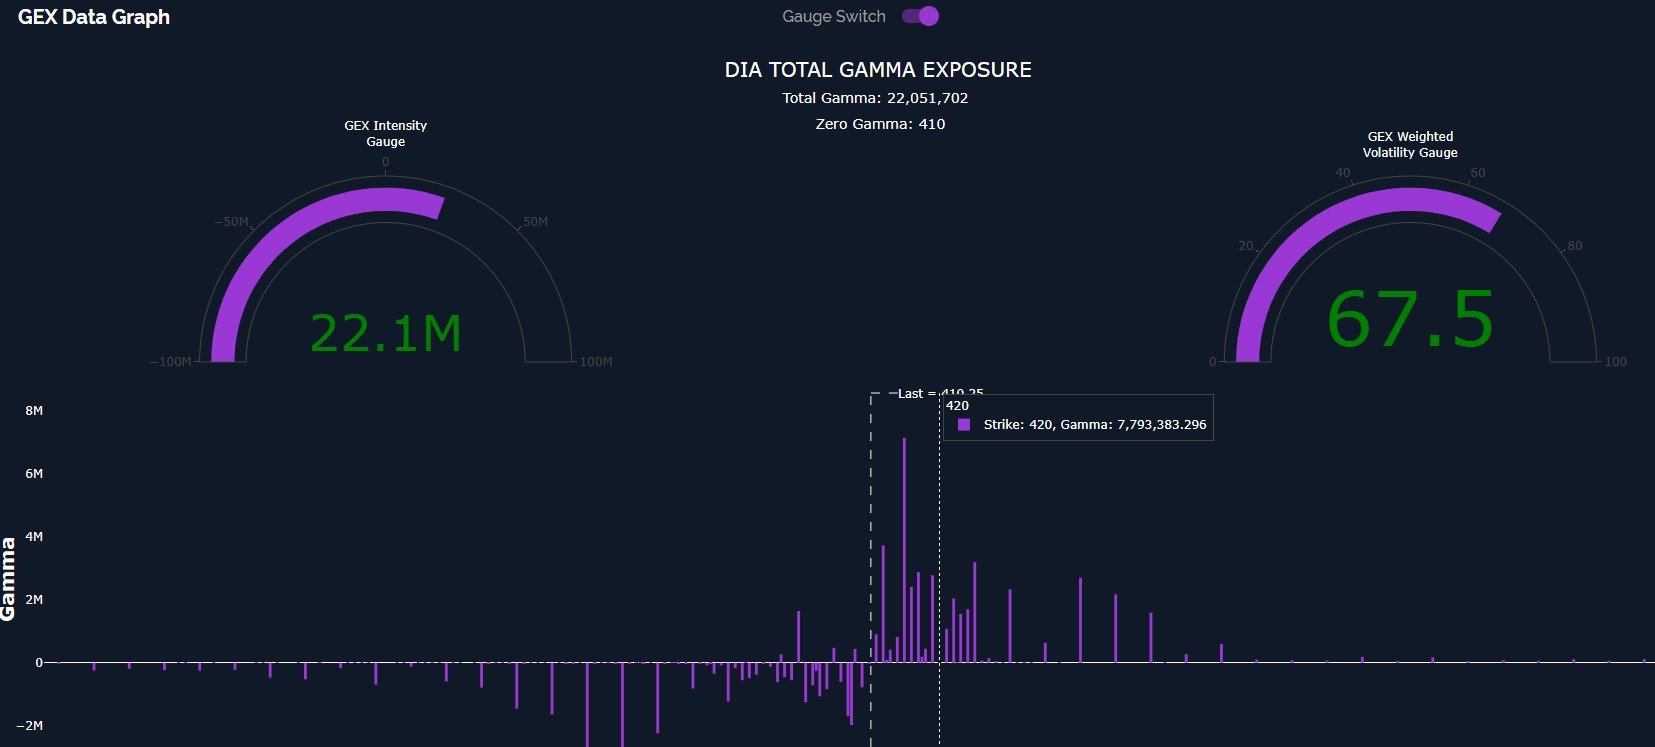
DIA GEX Data Graph: www.geeksoffinance.com
SPX never quite reached the 5480 I was hoping to see today, but the candle formed does show eager sellers on the rally attempt, noted by the wick overhead. The larger exposure to tech helped SPX on the way up, but at this point, it’s likely a drag in the very recent couple of months, contributing to the sharp drop these last couple of days despite DIA not dropping nearly as much.
I will be watching the general 5480 area (give or take a few points) to hold IF SPX is to stage a near-term rally. 5480 does (again) make sense as a spot from which to see a rebound attempt, but a loss of that area can see a sharp and fast drop.
The VIX appears revved up and ready to roar, so any bounce may be short-lived and mostly serve to shake off nervous shorts, in theory.

SPX chart: TradingView.com
Going back-and-forth from positive to negative factors, SPX is entering a dealer cluster zone where we might see buying, though the depth of that box implies price can be in the zone for another hundred points, so we can’t base a buying decision strictly based on that.

SPX GEX Levels Chart: www.geeksoffinance.com
SPX GEX barely moved up, so get out your magnifying glass to see the “positive” move to -358.4M total GEX. Certainly less bullish than DIA, for comparison.
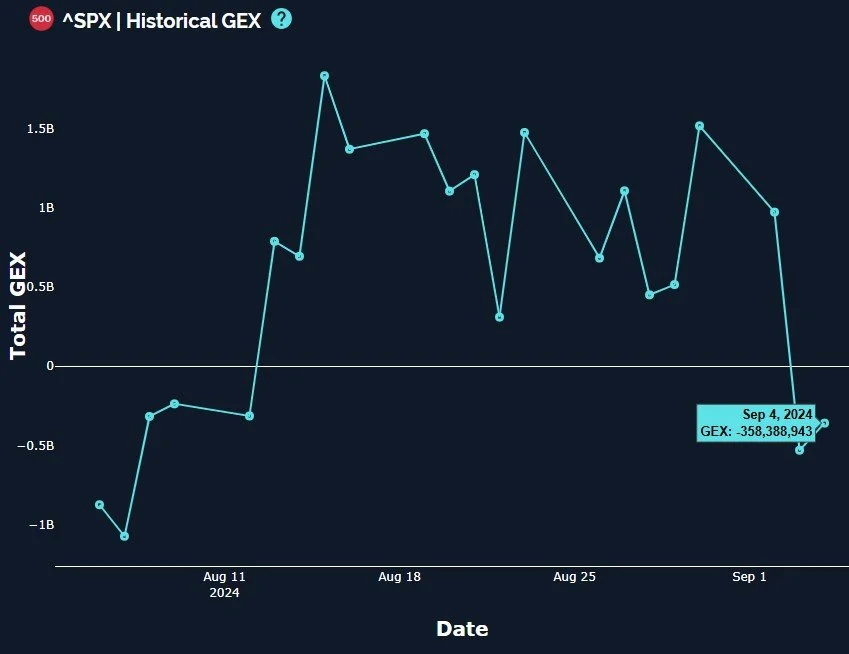
SPX Historical GEX: www.geeksoffinance.com
Looking at the SPX 3D chart on our website, I see negative strikes have grown in the near-term, with 5400-5450 in focus as we look to this Friday, and most positive strikes are positioned further out in time (late September). Perhaps the pullback extends into the end of this week?

SPX 3D Graph: www.GeeksOfFinance.com
QQQ continues to look the worst, rejecting perfectly off of the daily Keltner channel, leaving 441 in focus, awfully close to the 440 we mentioned last week as a possible future target for QQQ.

QQQ Chart:TradingView.com
The weekly Keltner gives some hope for bulls in that price has stopped right above the 457.91 middle Keltner. If this level can hold, it’s not out of the question to see an effort to retest the Hull Moving Average at 478 from below, though the Hull will likely continue moving lower short term, so 478 may be a bit lower by the time price reaches that point.

QQQ weekly Keltner chart: TradingView.com
What’s Next?
Alright, so DIA looks the most bullish, but everything looks fairly weak at this exact moment..Where does that leave us? We have quite a few data points being released tomorrow, with ADP and Jobless Claims premarket and PMI as well as ISM 15 and 30 minutes after the market opens. These events can certainly create volatility in one or even both directions, and with the VIX more elevated again, we like to trade smaller size and give positions more room, as long as the data behind the trade looks solid. GEX gave us some decent setups today and we will be watching for more tomorrow!
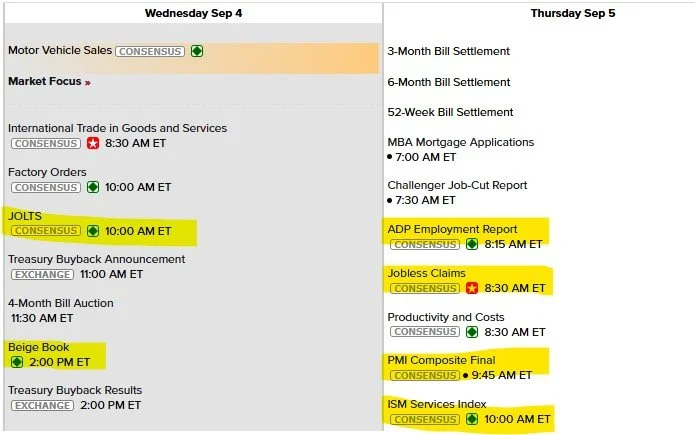
Economic Calendar: www.econoday.com
If you’re interested in learning more about our strategy approach, we address all of these topics in our Geek University course which is included in all memberships.
If you’re interested in accessing our tools and analytics, be sure to check out our website!
Thanks for being part of our community and know that we invite your feedback!
We have a variety of educational videos on YouTube as well!
The information provided by Geeks of Finance LLC is for educational purposes only and is not intended to be, nor should be construed as, an offer, recommendation or solicitation to buy or sell any security or instrument or to participate in any transaction or activity. Please view our Investment Adviser Disclaimer and Risk Disclosure.