
9/11: Consistently Bullish For 17 Years
For the last 17 years (even though the table below only shows the last 14 years), 9/11 has been largely bullish. The table below shows SPY performance from the close of the prior day to the intraday high of either 9/11 or the next trading day (if 9/11 was a weekend day). Seems like there’s a really high probability of being positive tomorrow for at least a fleeting moment, if history is our guide. But with CPI premarket tomorrow at 8:30 AM ET, we may see a big move (potentially down?) before the market even opens. Will CPI ruin a longstanding market tendency? We discuss various other aspects and some specific tickers on our YouTube video posted tonight, which you can view here.
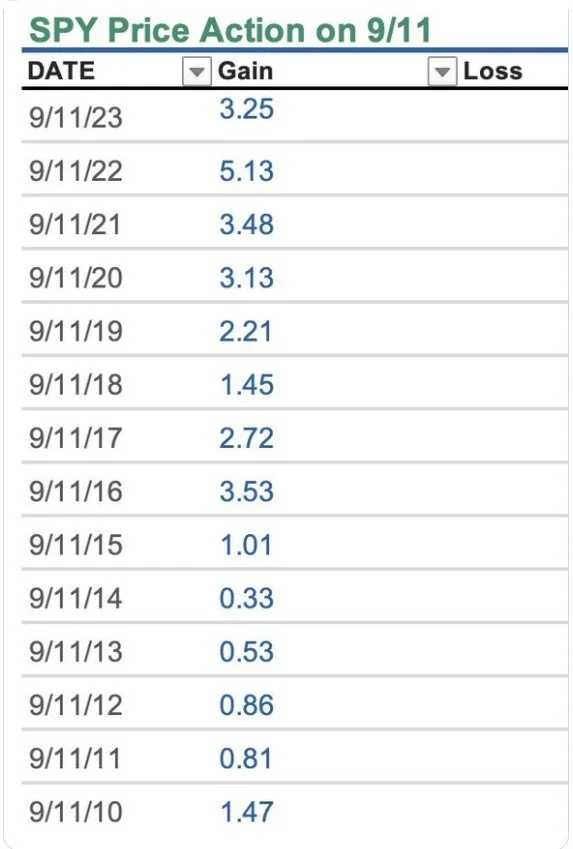
Source: X.com (@market_sleuth)
In our YouTube video (link in the first paragraph), we mention SPY 540 and 550 as potential bull/bear lines. Let’s take a look at SPX from a slightly different perspective using various indicators on the chart below. We are below the Hull Moving Average (the pink line), which we consider bearish. We are just below the middle Keltner channel on the daily chart, which leaves open the possibility of tagging 5300 below. Yet we know recent history on 9/11, and an argument can be made that the chart shows consolidation before another leg higher.
We know the market tends to trap bulls and bears alike, so we also have to look one step ahead and be watchful that any breakout above or below the current levels may reverse for a larger move in the opposite direction.
Hopefully we will see other signs (especially from gamma, also called GEX) that can tilt our odds as we look to make decisions with our trades.

SPX Chart: TradingView.com
Friday saw SPX total net GEX drop to deep within what we consider bearish territory at -1.4B, though much of that expired that day, leaving us with an apparently improved and neutral -115M GEX for SPX. SPY remains deeply negative at -1.74B currently. Both are technically negative (though SPX is considered neutral), and neither are deep enough to the negative side to create a contrarian positive signal.

SPX GEX Levels: www.geeksoffinance.com
SPX Total GEX just reached positive territory again, still technically neutral, but the dramatic 2-day change shows how fast GEX can shift with a market so focused on short-term positioning. In summary for SPX, we have consolidated just before an important CPI report and a week away from the Fed meeting, leaving open more than one possibility of how things play out.

SPX Historical GEX: www.geeksoffinance.com
We’ve spent some time comparing DIA to SPY/QQQ in recent days, noting the relative strength and also analyzing the different makeup of the indices, with DIA having more healthcare, industrial, and defensive exposure compared to the tech-heavy S&P and Nasdaq. We saw DIA somewhat switch places with SPY today, largely painting a similar candle but still closing below yesterday’s close, whereas SPY showed greater strength. But the positioning relative to the Keltner channels is more bullish for DIA, testing and holding the middle Keltner support, while SPY is dealing with overhead middle Keltner resistance. Both are below the Hull, though.
GEX backs a possible move to 418 (Friday’s expiration shows notable concentration) or 420 as a DIA upside target. We need to see what happens if DIA reaches 412 first, which may serve as resistance before a push beyond that.
DIA and SPY don’t always move in different directions, so we need to be open to either DIA rising while SPY drops, or potentially rising tides will raise all ships, as the saying goes. Bottom line- DIA has an argument to be made that it’s more bullish than SPY in the near term.
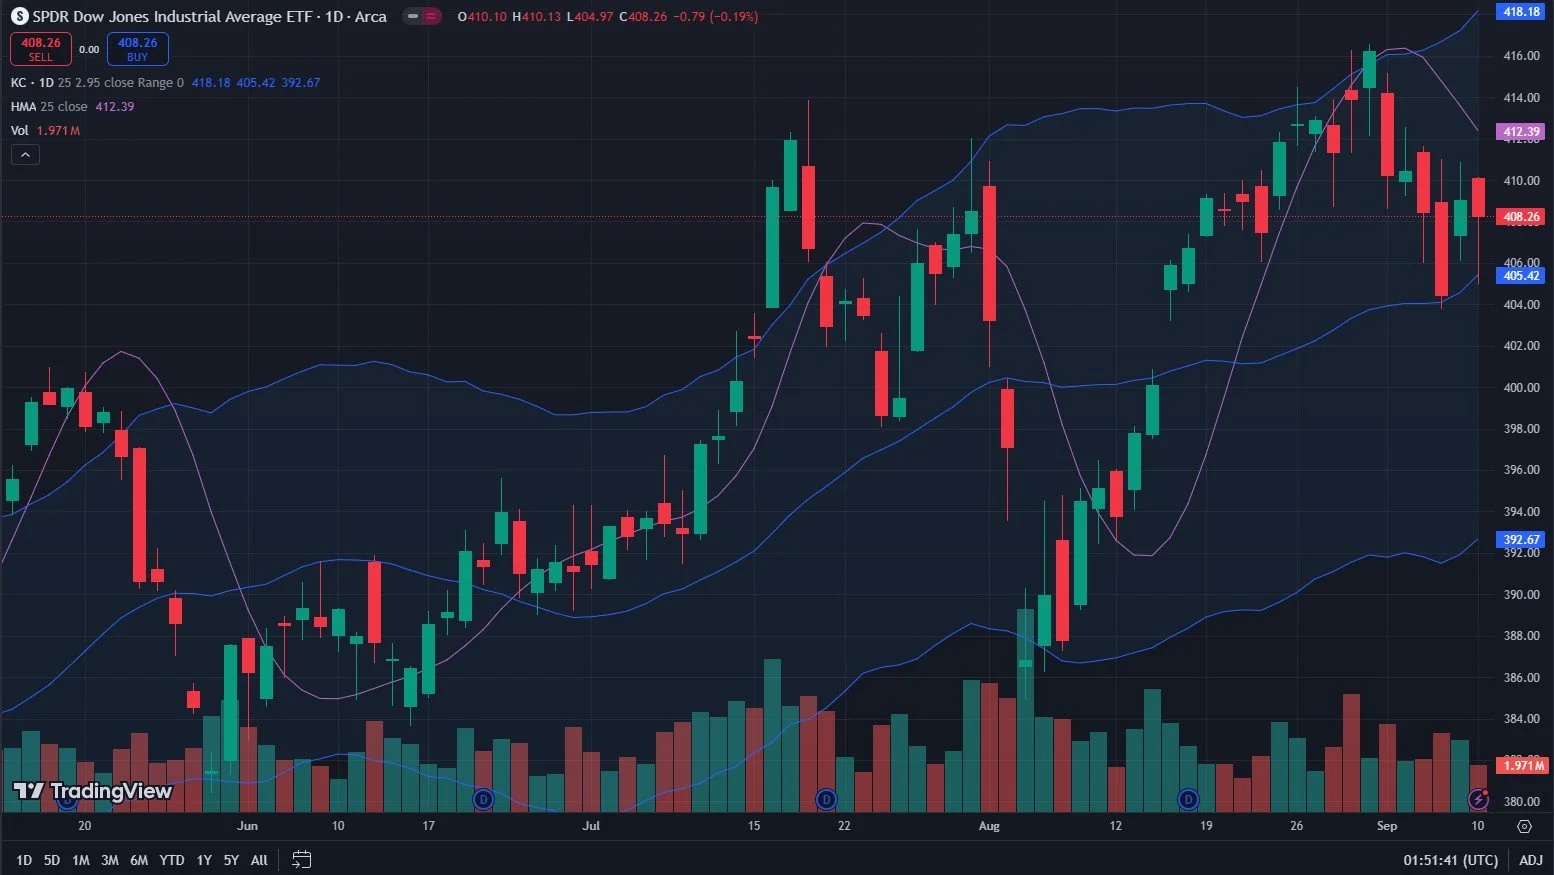
DIA Chart: Tradingview.com
Lastly, the VIX holding the Hull at 18.63 leaves a bias toward another VIX spike. I don’t analyze the VIX strictly from a standpoint of trading VIX options, but rather trying to get a sense of how volatility may expand or compress and the likely impact on markets as well as option premiums. The VIX also tends to be “trappy,” with volatility making sometimes extreme moves in the short term and abruptly changing course.
A contrarian perspective holds that any extreme move up OR down between now and next week may set up an opposite move toward the Fed decision, which (if true) would actually make my job easier in terms of reacting to the first move instead of shakily gritting my teeth and trying to guess in advance which way we’re going.
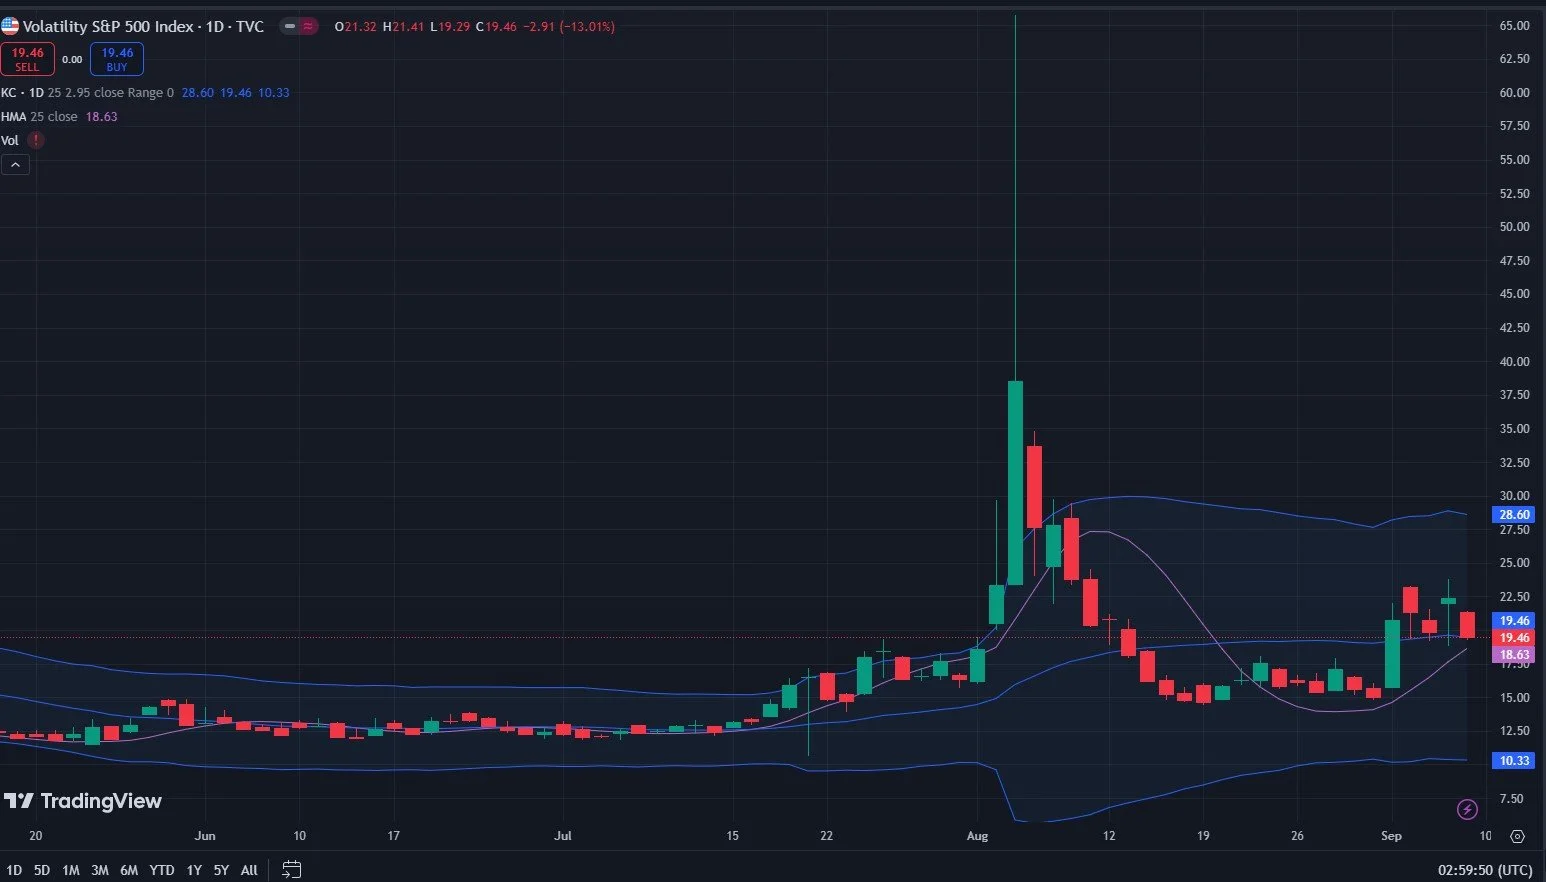
VIX Chart: TradingView.com
Join Us In Discord For Intraday GEX Updates 9/11
Tomorrow holds promise as a potentially volatile day, so we invite you to join us in our free Discord channel (or become a paying subscriber for a lot more) And we will share some real-time updates on how we see GEX shifting in the 0 DTE markets. Hopefully you’ll join us!
If you’re interested in learning more about our strategy approach, we address all of these topics in our Geek University course which is included in all memberships.
If you’re interested in accessing our tools and analytics, be sure to check out our website!
Thanks for being part of our community and know that we invite your feedback!
We have a variety of educational videos on YouTube as well!
The information provided by Geeks of Finance LLC is for educational purposes only and is not intended to be, nor should be construed as, an offer, recommendation or solicitation to buy or sell any security or instrument or to participate in any transaction or activity. Please view our Investment Adviser Disclaimer and Risk Disclosure.