
QQQ: Teetering On The Edge
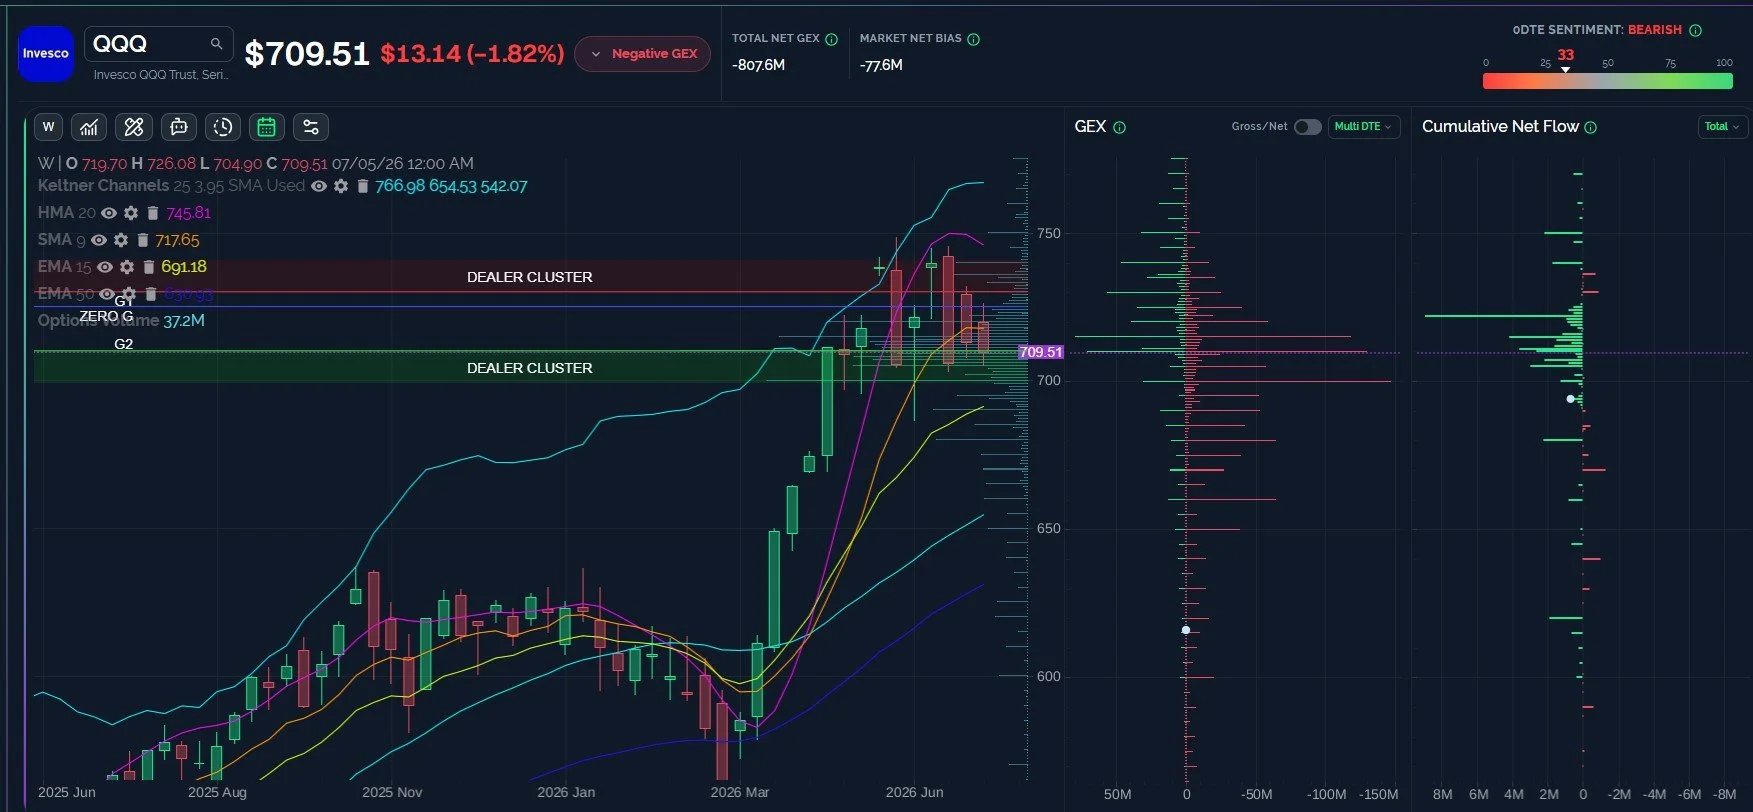
SPX has been outperforming QQQ this week, a possibility alluded to more than once over the past week or so. My reasoning is that semis have helped QQQ immensely, but they’re starting to look weaker. Any rotation toward software or Mag 7 will help both indices to be stronger than they would be otherwise, but SPX has less semiconductor exposure, and more of the other sectors that have already gone through serious pullbacks (look at any defensive stock). At this point, QQQ is on the edge of important support at 700, closing just below a big GEX area at 710. The VIX looks ready to spike toward 18-20. Can SPX maintain a large positive divergence? Is SPX signaling that QQQ is faking us out to the downside?
Members save a special $375 on the annual Portfolio Manager plan with code FREEDOM26 at checkout, which will run a few more days.
QQQ Is Below Key SUpport On Daily And Weekly Charts
QQQ closed just below the 710 GEX area, close enough to wonder if we gap back above it tomorrow, but the risk exists for QQQ to test 700 and then the weekly 15 EMA at 691. In addition to the large GEX ceiling at 710, we have another big GEX cluster at 715, so QQQ has some battles to fight above in order to reassert a more bullish-looking picture, in our view. Recapturing the weekly 9 SMA at or over 718 starts to look more bullish, with 730-745 representing a target range for a rebound.
Key Levels: Bullish above 718 targeting 730. Bearish below 710 targeting 700, then 691.
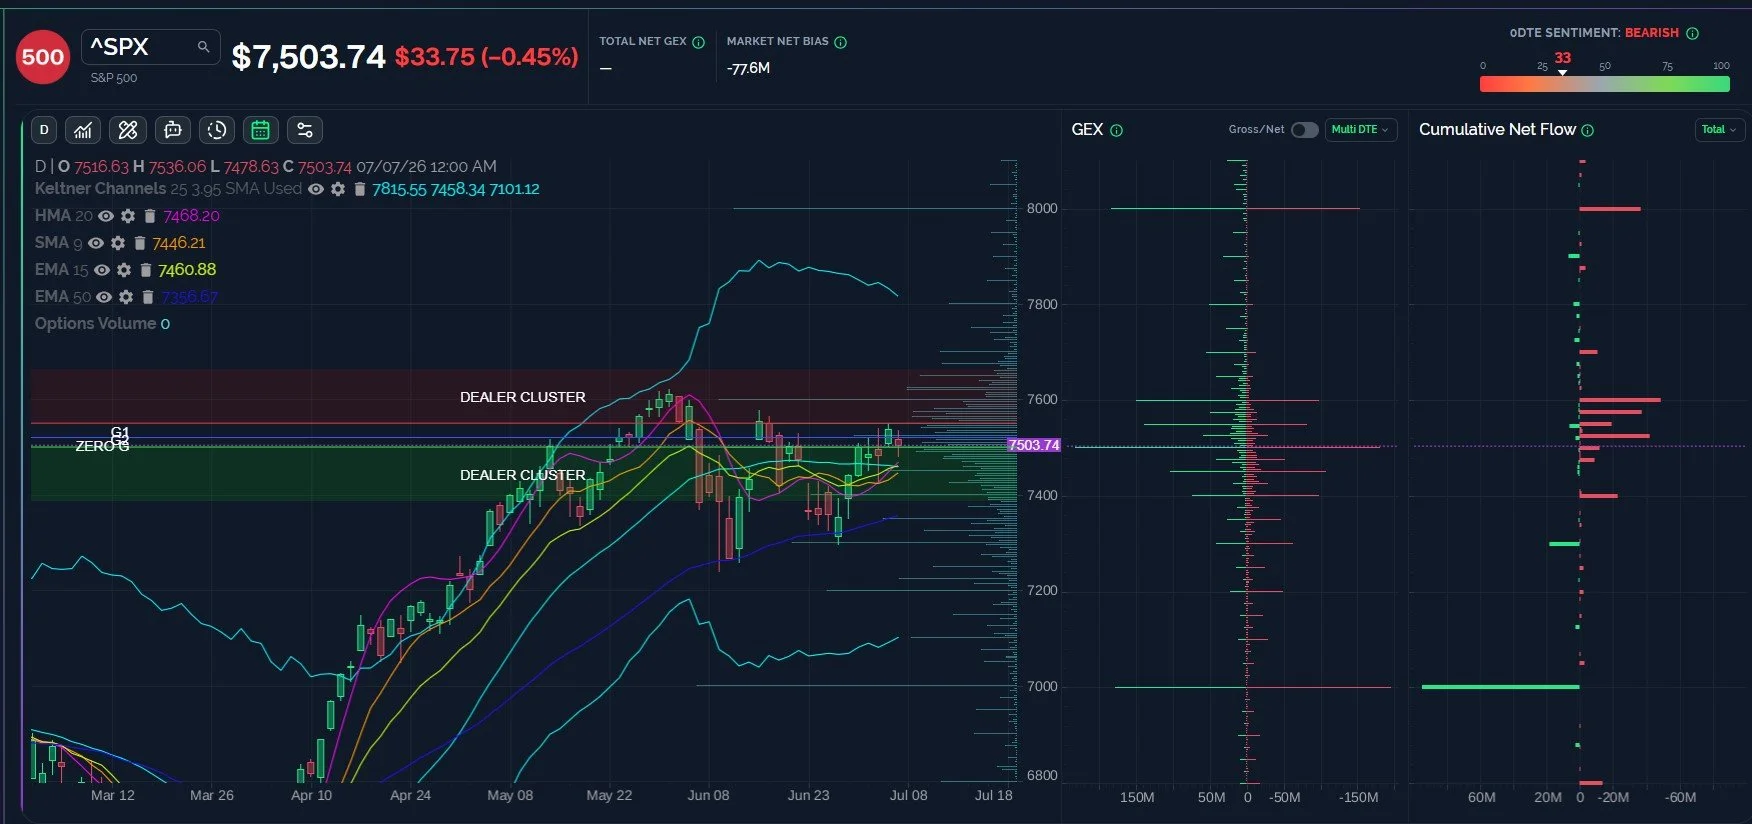
SPX Still Doesn’t Break A Sweat Until It Loses 7450
Today’s low on SPX was well above our line-in-the-sand at 7450, rebounding off of the 7478 level and closing above 7500. Quite the divergence for SPX relative to QQQ, and SPX is still above all of its daily indicators on my chart as well as key weekly supports. Can such divergence last? It’s possible, though I wouldn’t be surprised to see SPX catch down to QQQ, even if its drop is much more modest than QQQ’s. The other possibility is that QQQ is faking the market out and we’ll see QQQ rebound to catch back up to SPX. I only lean slightly toward a downside scenario because of IWM and the VIX, which we’ll look at next.
Key Levels: Bullish especially above 7468 targeting 7550 again, then 7600. Bearish below 7450 targeting 7400, then 7300.
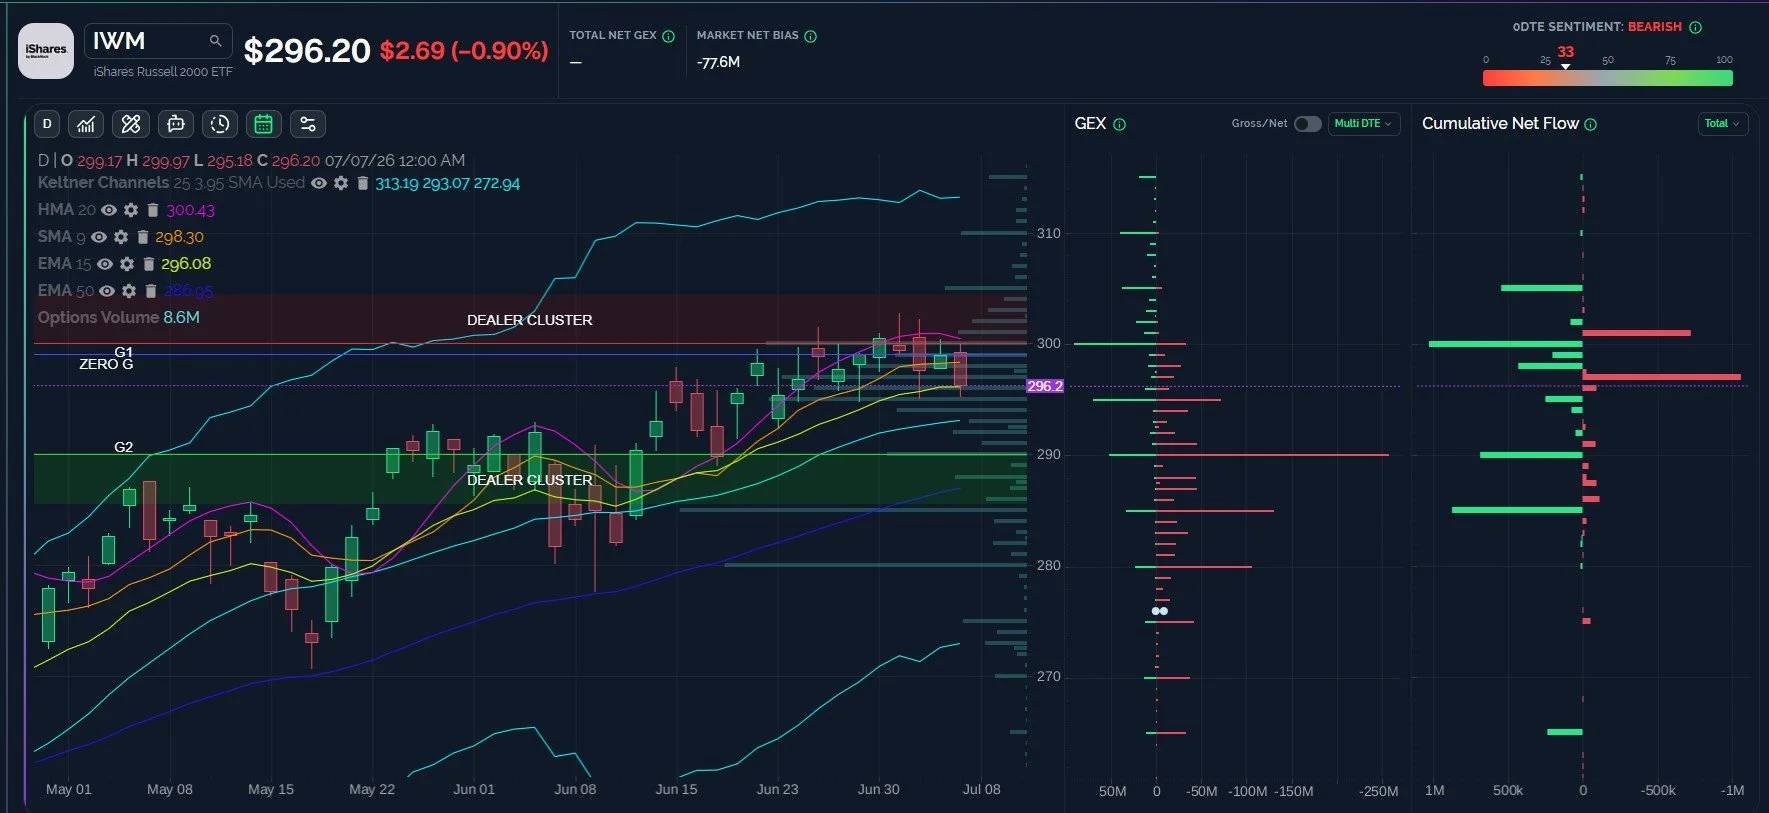
IWM Is Barely Hanging On- A 290 Test May Be Incoming
IWM’s daily chart is starting to look like a slow rolling over is happening, with the HMA and other indicators turning downward as GEX has shifted lower. We still see major GEX support at 290, though downside targets range from 280-290 if we see continuation lower. The close today right at the 9 SMA looks dicey, and we really want to see IWM retake 300 if we are going to see higher prices in the near-term.
Key Levels: Bullish above 300 targeting 310. Bearish below 296 targeting 290, then 285.
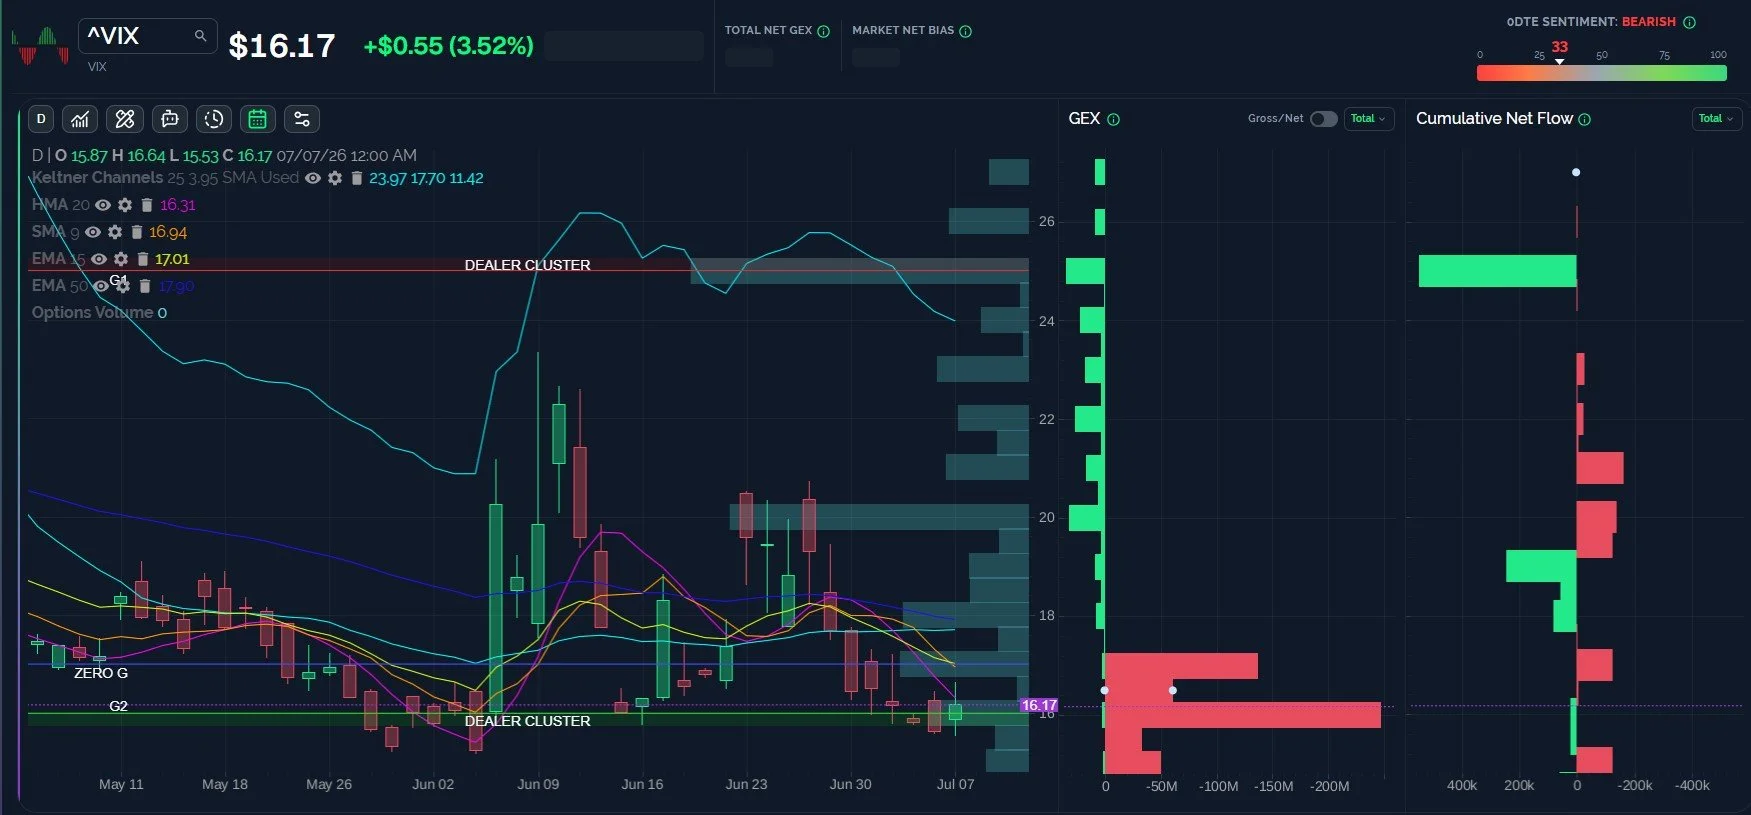
The VIX May Be Headed For A Test Of 20
The VIX was surprisingly weak today, despite QQQ’s weakness. SPX outperformance likely helped a lot, given the VIX’s relationship to SPX options. Negative GEX is still clustered at the 16 and 17 strikes, and the HMA at 16 and 9 SMA at 17 line up nicely with both of those GEX clusters. The 2-hour and 4-hour HMAs support a move to 18-20, but I’d like to see the VIX get above 17 to raise the odds of a spike to 20, given the 17 strike’s importance on the daily chart.
Key Levels: Bullish above 17 targeting 18-20. Bearish below 15.9 with limited downside to 15.
Join The discussion
We hope you will join us in Discord this week, where we share at least some observations every day for free.
Our YouTube tonight discusses SPX, the VIX, BTC, AMD, and PLTR, so check it out to hear our thoughts on these tickers and the broader market. This video and prior videos can be viewed by clicking Community at the top of our homepage to find our YouTube channel link.
Non-subscribers can join through Community on our homepage. First-time guests get a free 7-day trial of the premium Discord channels, where we talk through what is happening in real time.
We run a livestream from the homepage every day around 10:30am ET, and you can replay the most recent one any time before the next.
Thanks for being part of our community and know that we invite and appreciate your feedback!
The information provided by Geeks of Finance LLC is for educational purposes only and is not intended to be, nor should be construed as, an offer, recommendation or solicitation to buy or sell any security or instrument or to participate in any transaction or activity. Please view our Investment Adviser Disclaimer and Risk Disclosure.
