
SPX Collapses: How Much More From Here?
Friday’s impressive drop was accompanied by a VIX spike above 20, a huge 32%+ move for the VIX. We think it’s too early to say whether or not markets continue lower, but tonight’s newsletter discusses some levels that might see a reaction up or down as we await confirming signals this week.
Members save $300 on the annual Portfolio Manager plan with code MAYFOMO at checkout, which we extended until June 8.
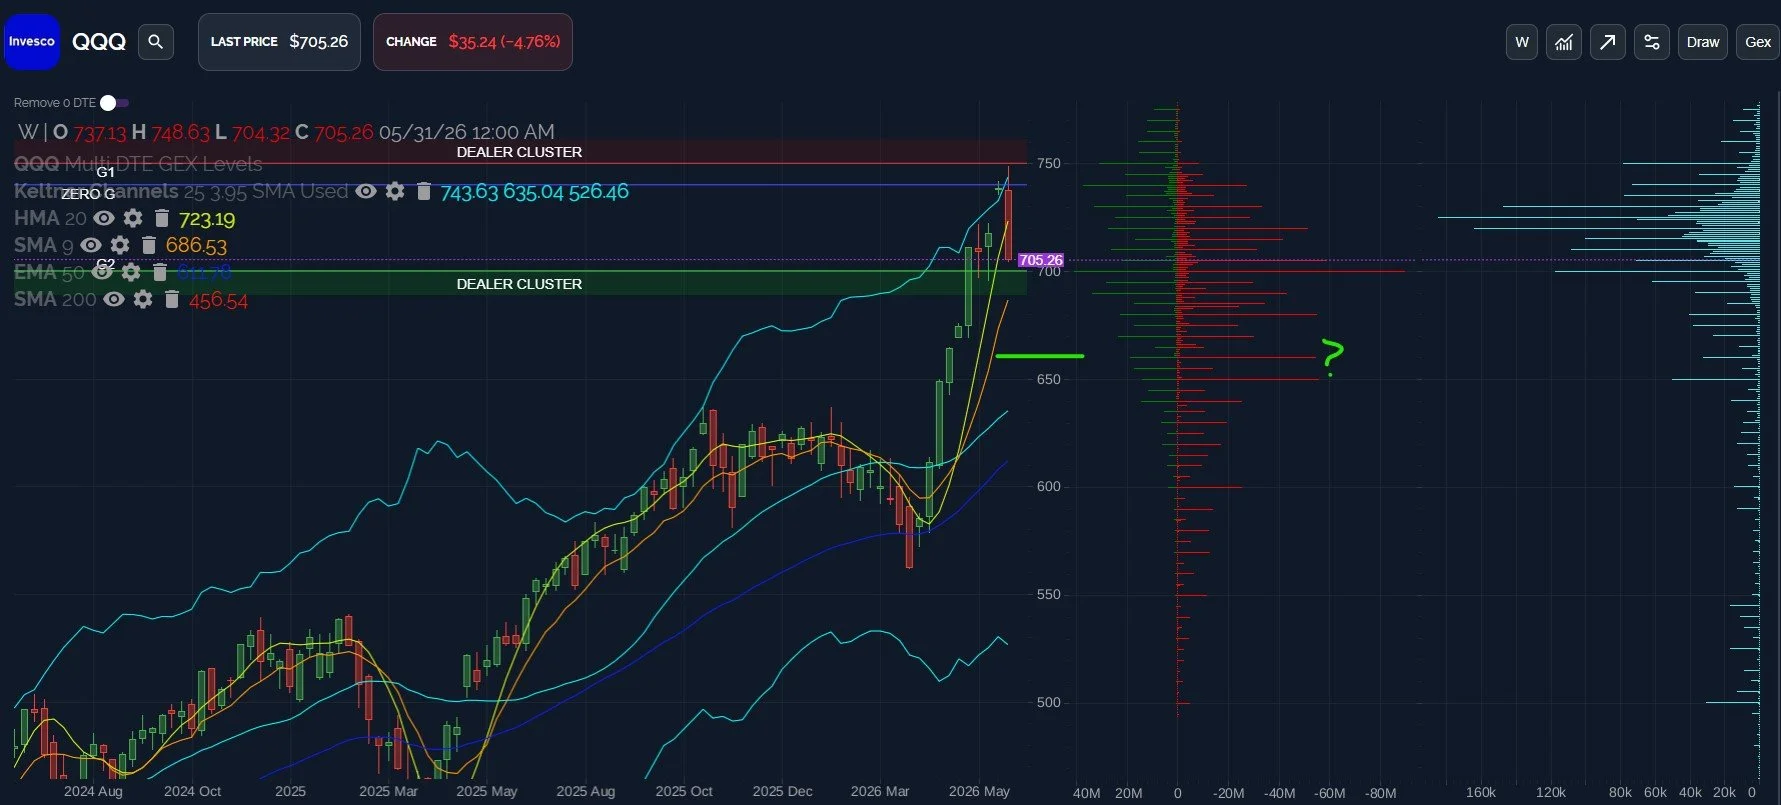
QQQ: Weekly Keltner Channel Vindicated
One of the consistent themes in our livestream and in the newsletter over the last two weeks was attention to QQQ’s position at the upper weekly Keltner channel, an area that has often acted as resistance in the past. This time around, QQQ made it almost 2 weeks before gravity took hold on Friday, but the drop was impressive once it happened. QQQ is at the doorstep of the 700 strike, a big GEX area that might represent an important pivot. GEX is negative, so moves in either direction can be magnified relative to when we are in a solid positive GEX position.
Looking lower, 650, 660, 686.50, and 700 all show large negative GEX positions, potentially indicating targets to the downside in the event of continuation lower. I also like the general confluence with the halfway point between the start of the move higher and the recent high. In the short run, I wouldn’t be surprised to see a bounce materialize from the 686-700 area, or upside resistance between 720-723 could lead to another leg lower. This is where we need to wait for Monday’s 0 DTE GEX picture after the open as well as observing premarket price action.
Key Levels: Bullish above 725 targeting 750, resistance below 725 could lead to 700, then 685.
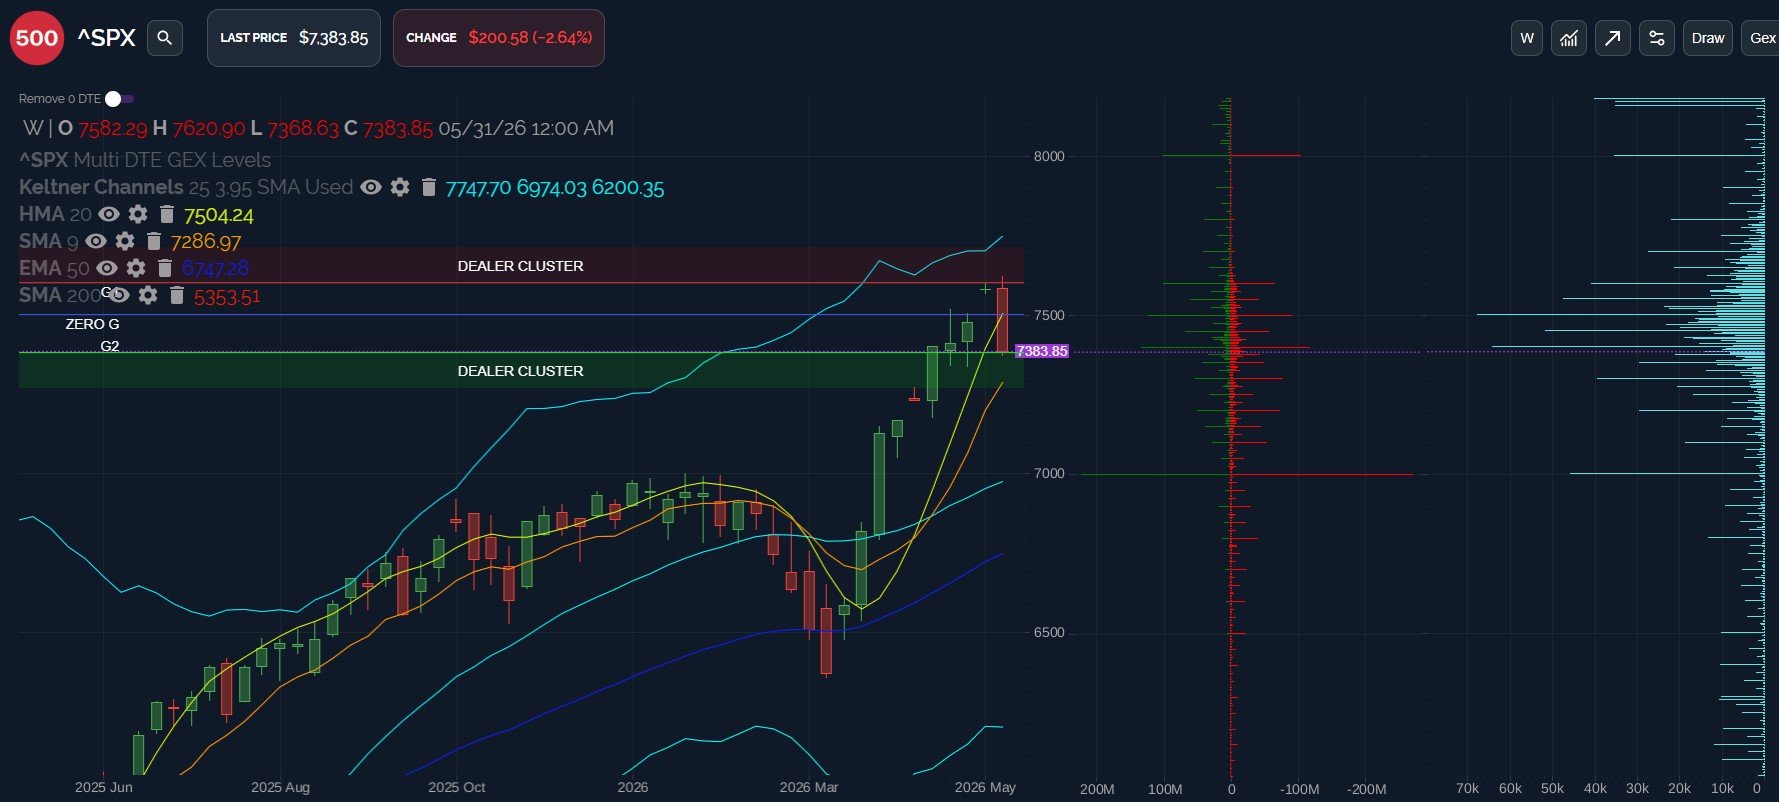
SPX Weekly: “Do Or Die” At 7287?
SPX surpassed the area we previously identified as a possible target for a drop at 7400, though not by much. SPX sits in the lower Dealer Cluster zone, though the zone spans 100 points, so we could still see a move closer to 7300 and SPX would be within the expected area of a potential reversal. Losing the weekly 9 SMA at 7287 may be a sign that we could see 7000 in a hurry. On the flipside, 7500 now represents important resistance, it’s up to bulls to retake control by closing above that level. Let’s look at the daily chart next before summarizing the key areas we’re watching.
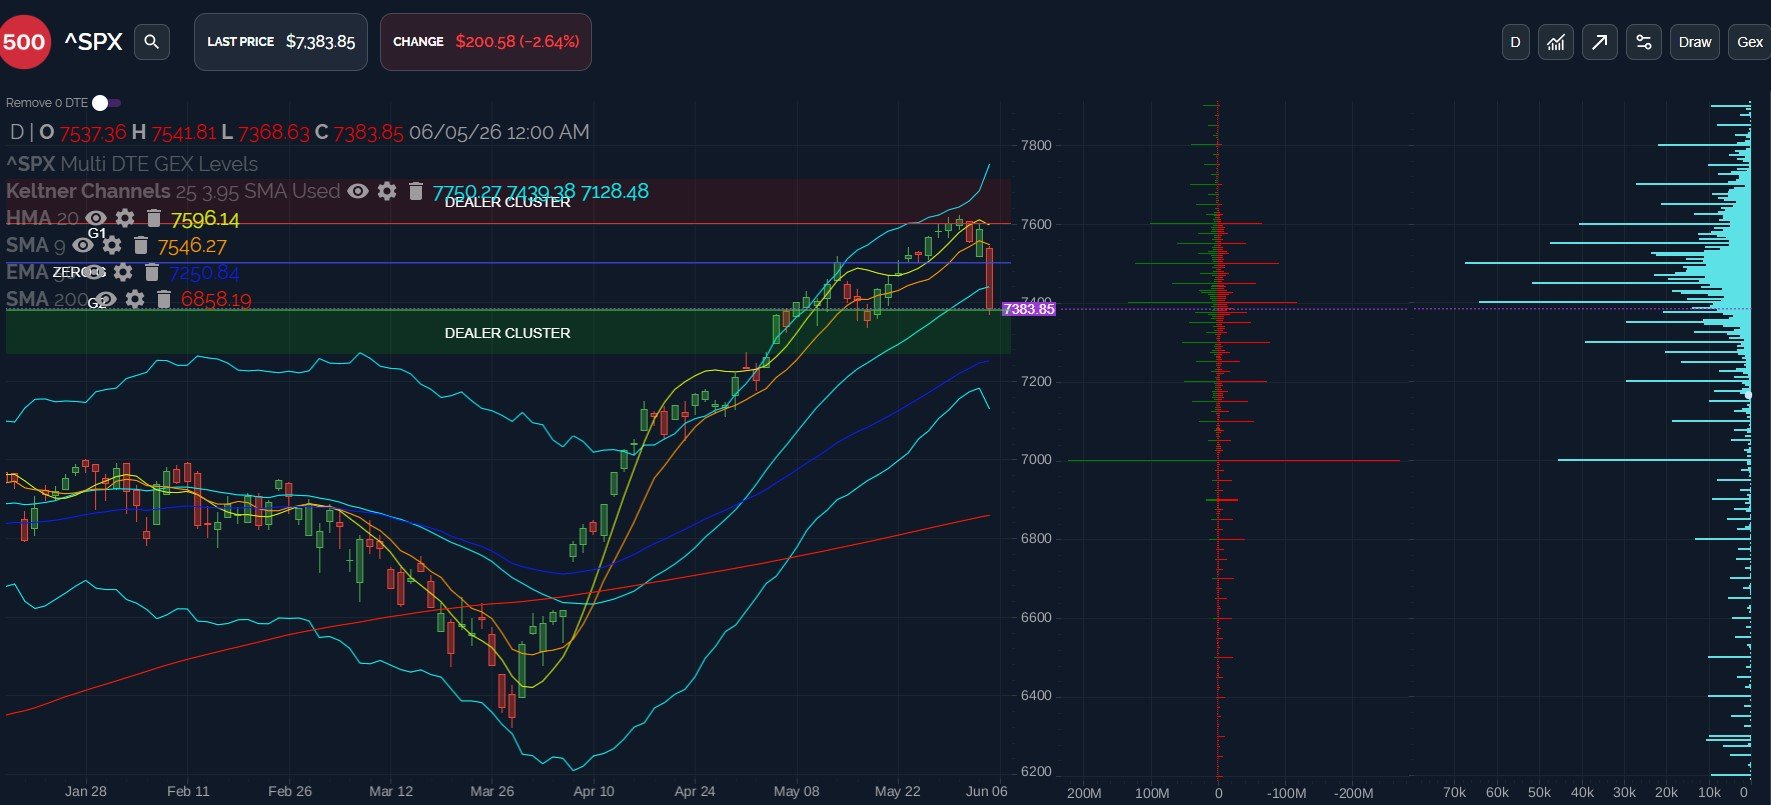
SPX Daily: No Support Until 7250
SPX’s daily chart muddies the water with wider technical levels on both sides: No lower support until the 50 EMA at 7250, upside resistance is at 7546, and the close below the middle Keltner channel adds another mark in favor of the bears. The HMA and 9 SMA are starting to curl lower.
Commonalities with the weekly chart include an appearance of being oversold in the short run, and of course GEX still suggests 7300 and 7500 are the next areas to watch, depending on what happens at 7400, the biggest pivot outside of 7000 and 8000 at the moment.
Key levels: Bullish above 7400, targeting 7504, then strong resistance at 7600. Downside targets include 7300, 7286, 7250, where we’ll consider new longs.
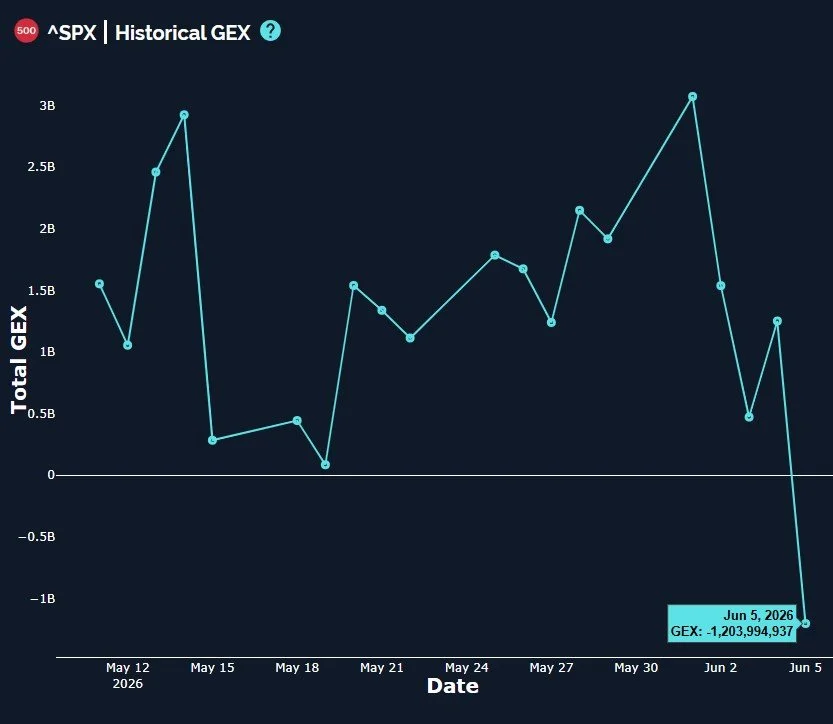
SPX NEt GEX Plunges
Before we move on, note that SPX saw a 2B swing in GEX to the negative as of Friday’s close, so the new negative GEX environment can experience greater volatility in both directions. We always consider this when looking at iron condors or other strategies that require our estimation of a likely trading range intraday. We also keep in mind that SPX reaching an extreme negative position (over -2.5B net GEX) can serve as a contrarian signal just like the positive 3B reading that we saw last week.
IWM: ‘Tis But A Scratch
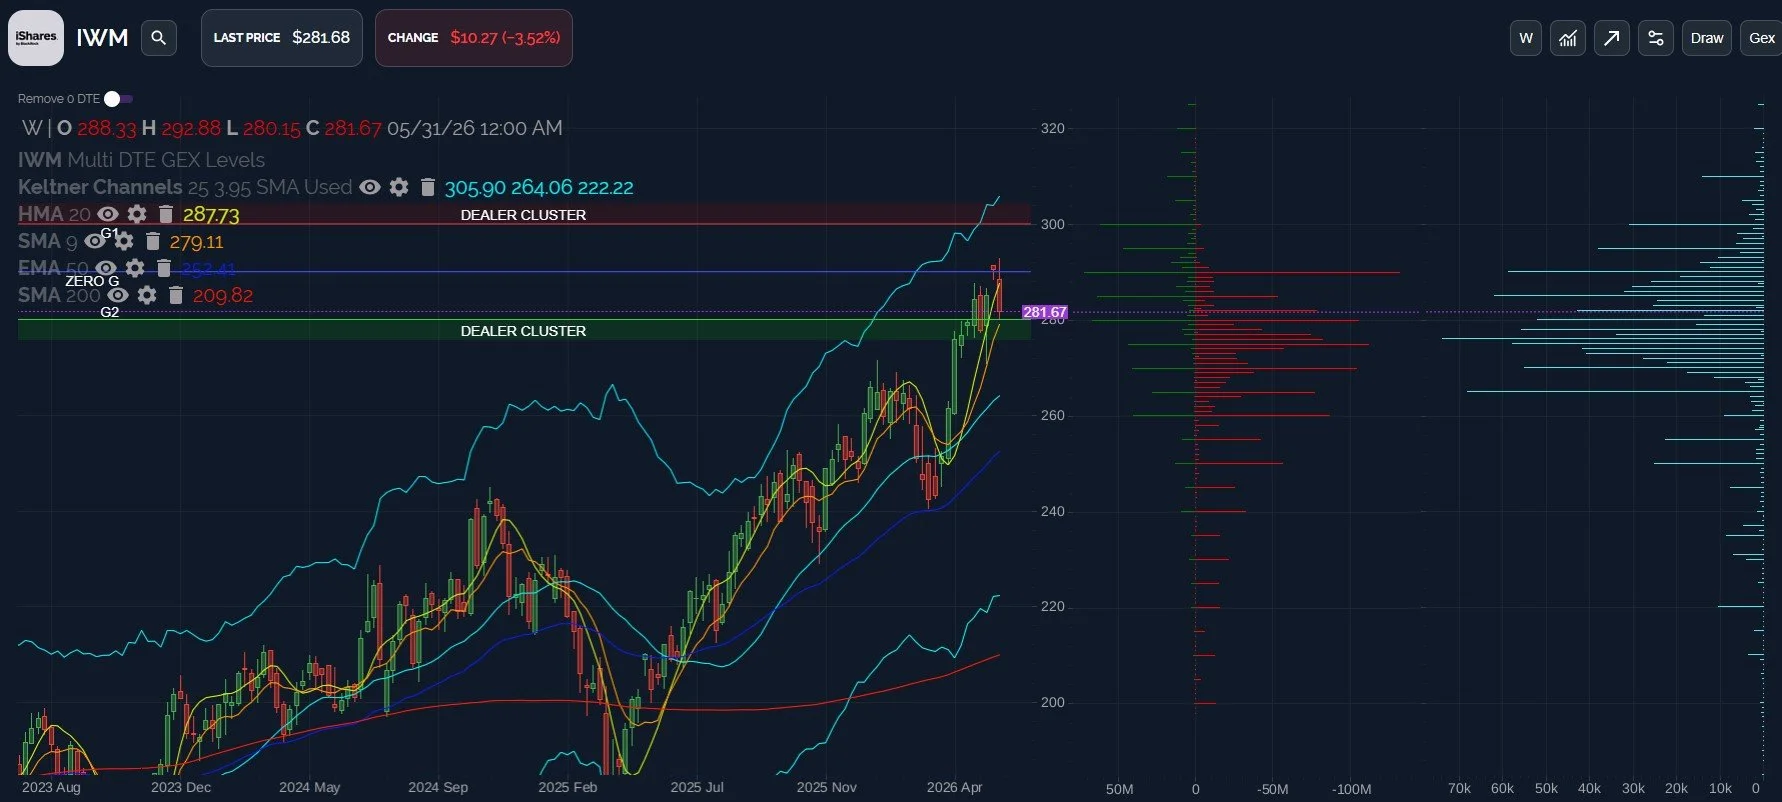
IWM performed better than QQQ Friday, and frankly, the chart doesn’t look as damaged. One reason might be that IWM didn’t rise in such an extreme fashion. We saw small pullbacks along the way, and a longer consolidation period between the initial thrust higher into May and the new high last week. The weekly chart below shows the drop stopping right at the 9 SMA at 279, and IWM closed above the key 280 GEX level. Significant GEX at every 5 points down to 260 represents potential pivot zones, with a lot of volume at 265 and above. 265-275 will be on my radar as a possible area in which to buy if we see further downside. IWM 290 looks like key resistance, opening the door to 300, if overcome on a daily closing basis.
Key Levels: Initial test of 290 is likely if IWM can hold above 280. Below 280, we want to see the downside action as IWM approaches 275, determining whether or not IWM continues down toward 265.
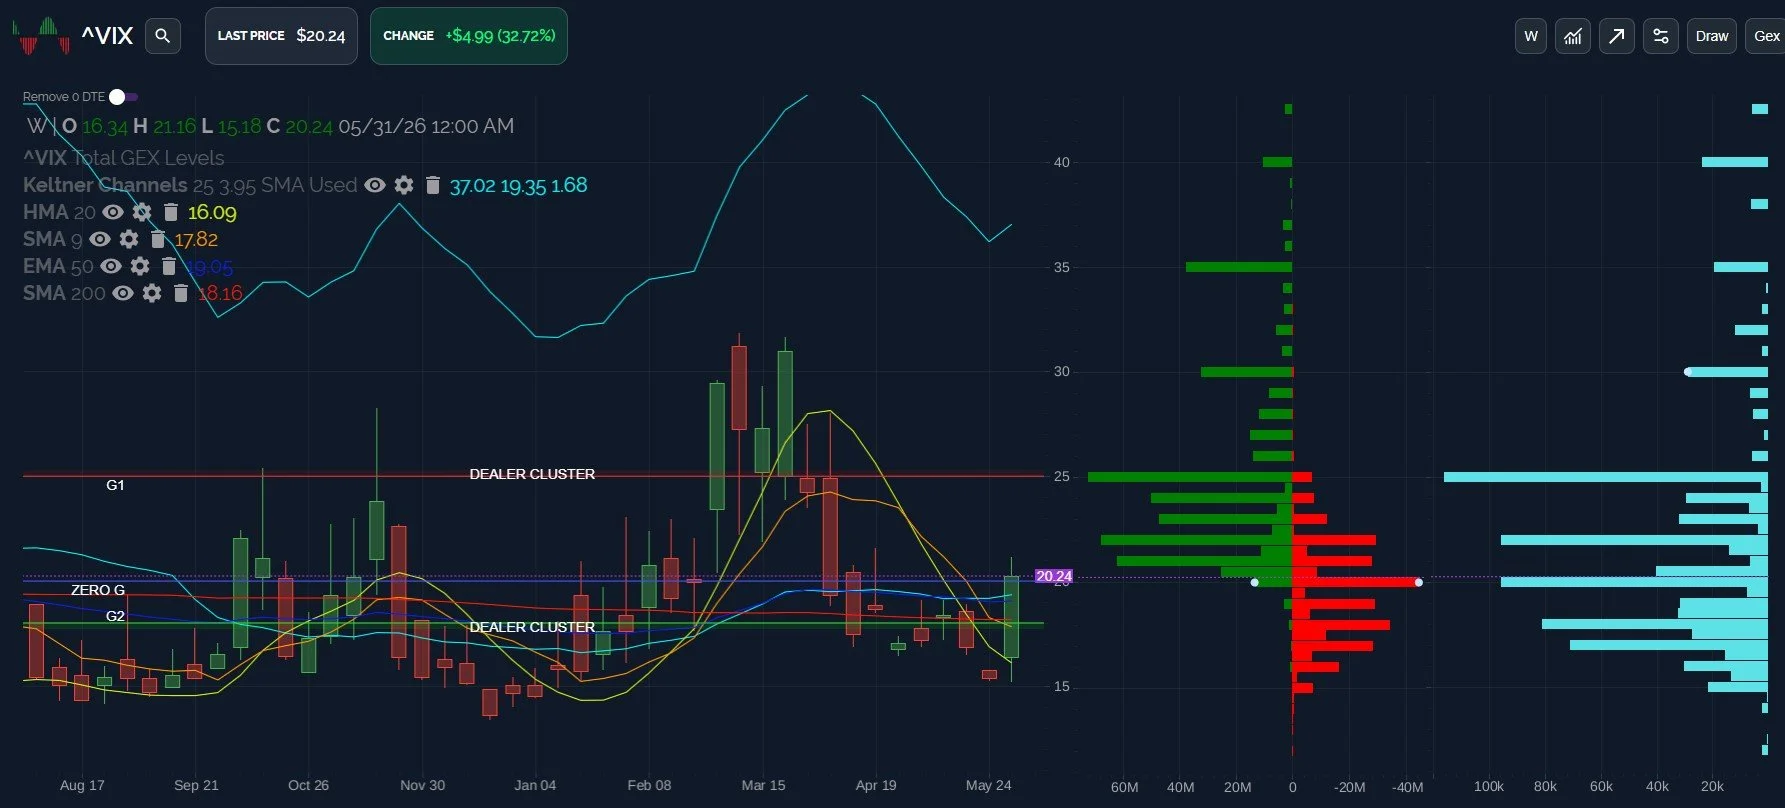
The VIX: RIght At The Zero Gamma Zone
In Thursday’s newsletter, I took the rare step of writing that I didn’t see a VIX downside target below 15 to even mention at that time. I looked for one, but couldn’t find it. I’m happy to say that we now have some downside targets following the nice (or not so nice?) VIX spike, but I can’t say whether or not we reach those targets before the VIX makes it way to the 25 strike. Action at 20 will be key on Monday, if given the chance to battle it out at that strike. Otherwise, maybe we see a retest of the 18.40 level, which I view as important for VIX bulls to maintain to have a shot at retaking 20 and then 25. A daily close below 18 may well see 15 fairly quickly again. The VIX is in positive GEX territory as of Thursday, and option activity was elevated up to 25 on Friday, so there’s a good chance this move doesn’t conclude until we see higher strikes ultimately reached. We’ll see what happens tomorrow for those first clues.
Join The discussion
Tonight’s YouTube video covers SPX, QQQ, the VIX, BTC, AMD, APP, and NOW, so give it a look if you have a few minutes! This video and our prior videos can be viewed by clicking Community at the top of our homepage to find our YouTube channel link.
Non-subscribers can join through Community on our homepage. First-time guests get a free 7-day trial of the premium Discord channels, where we talk through what is happening in real time.
We run a livestream from the homepage every day around 10:30am ET, and you can replay the most recent one any time before the next.
Thanks for being part of our community and know that we invite and appreciate your feedback!
The information provided by Geeks of Finance LLC is for educational purposes only and is not intended to be, nor should be construed as, an offer, recommendation or solicitation to buy or sell any security or instrument or to participate in any transaction or activity. Please view our Investment Adviser Disclaimer and Risk Disclosure.