
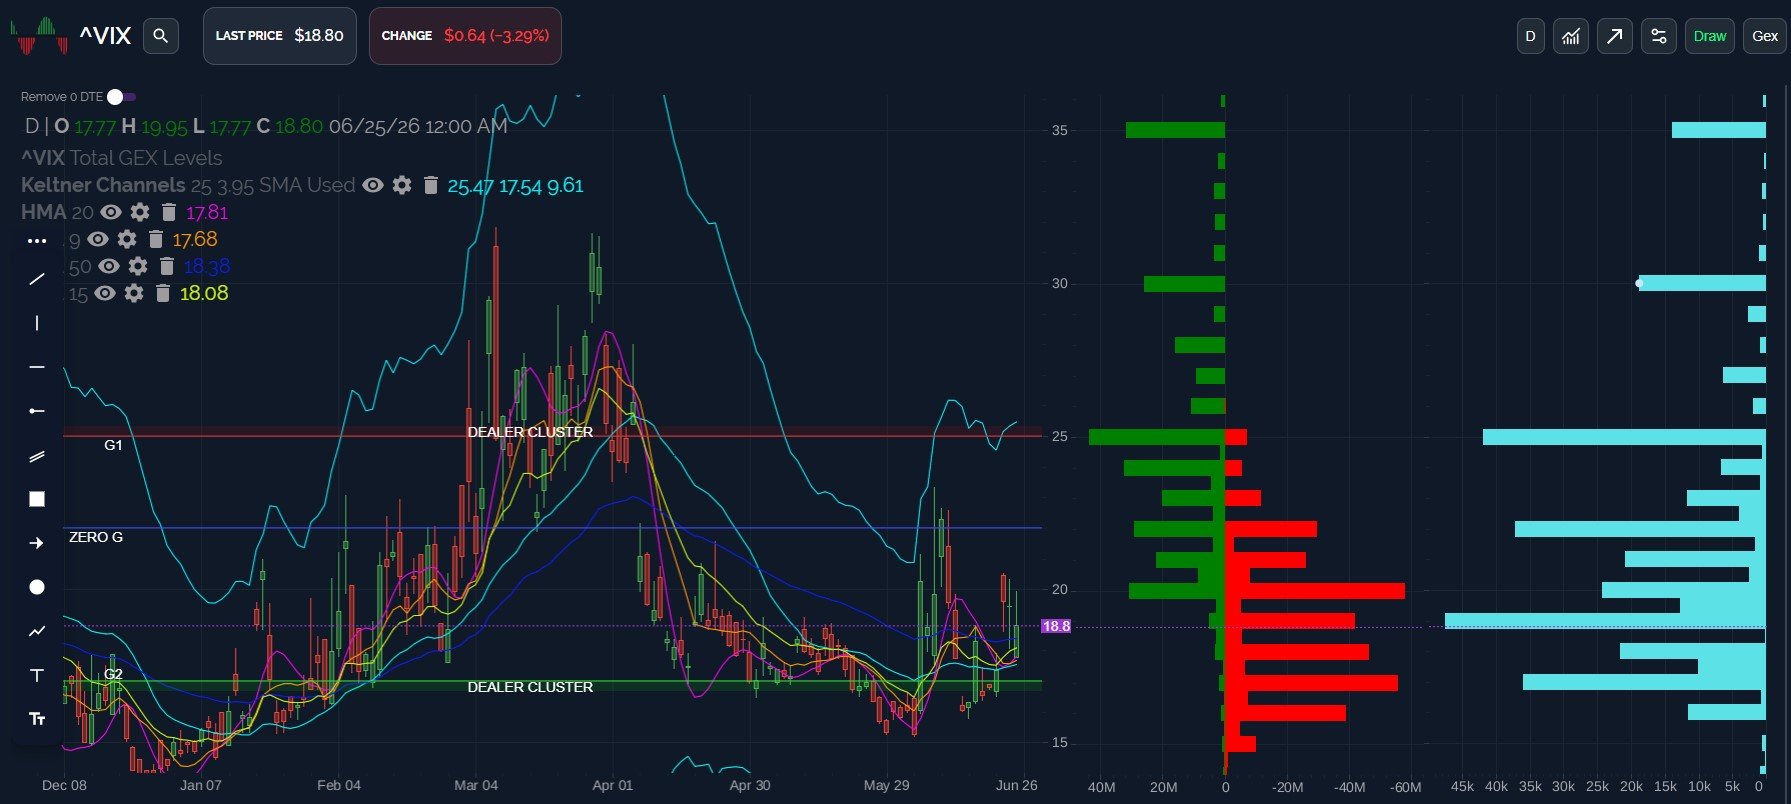
GEX Indicating Lower Into Month End?
Markets look indecisive heading into Friday, with most of the larger GEX clusters appearing to be at somewhat lower strikes into the end of June. The VIX maintains a setup to reach 22-25 as long as 17.50 holds on the downside. IWM is relatively stronger, targeting 303 into Friday, though so far, SPX and QQQ don’t indicate as positive of a picture, suggesting we might retest this week’s lows during the cash session. We’ll look at upside and downside levels that we’ll be watching.
Members save a special $375 on the annual Portfolio Manager plan with code FREEDOM26 at checkout, which will run through the July 4 holiday.
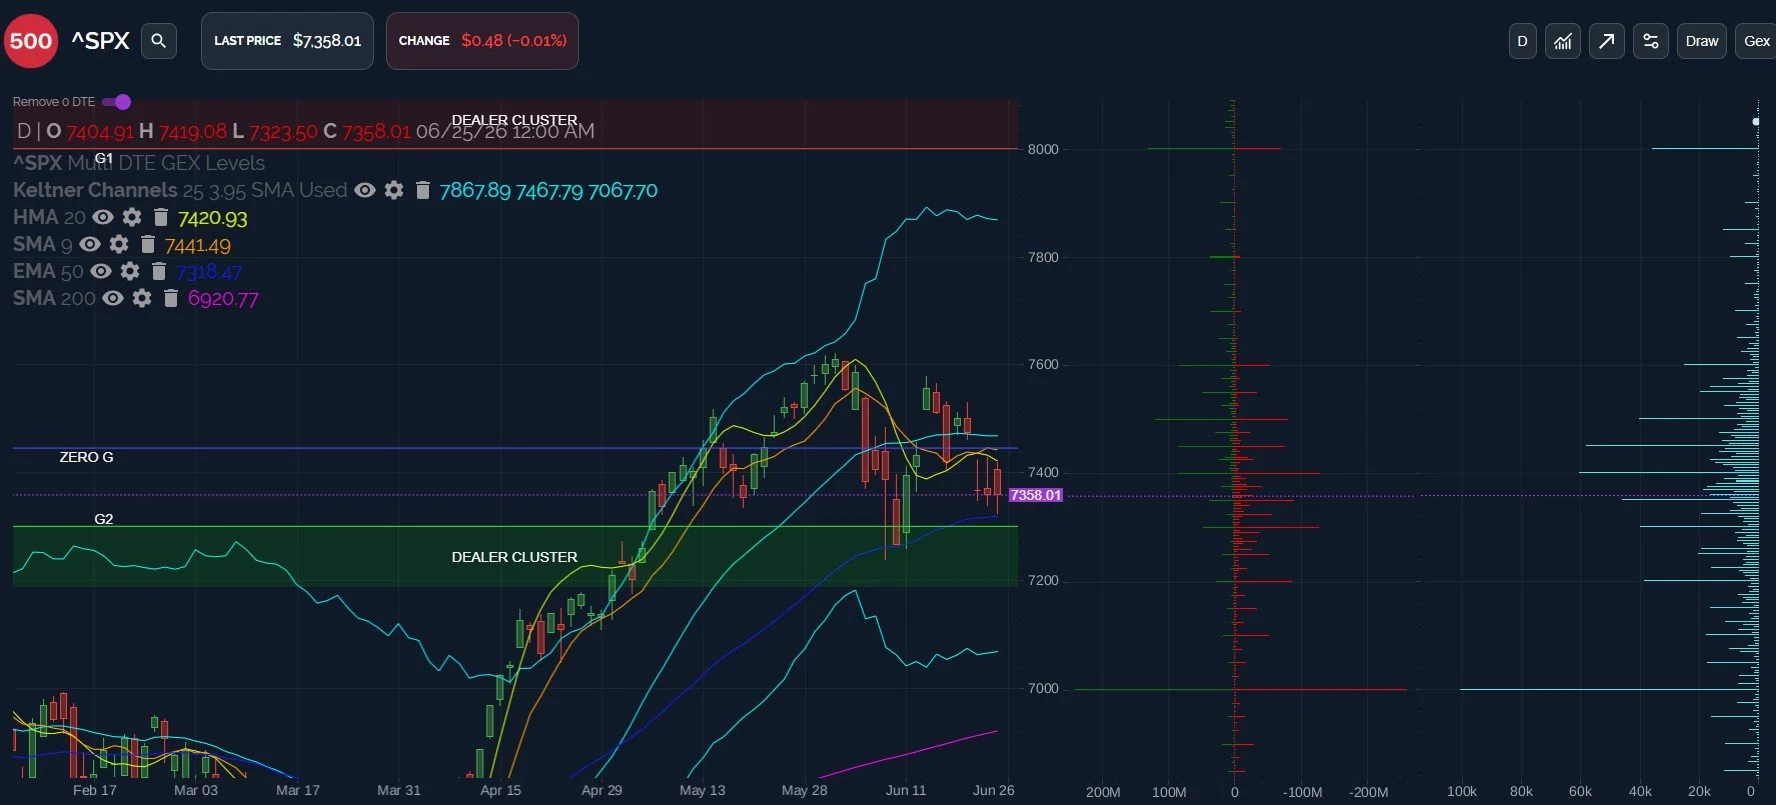
SPX: Looking At Downside And Upside Risk
The risk we mentioned yesterday of a drop closer to 7320 played out today, with 7323.50 marking the intraday low. The swings back and forth have been nice for contrarian traders this week, though the risk of a break in either direction beyond the current range may rise in coming days. GEX hasn’t shifted much for SPX over the last two sessions, ever so slightly improving from the low of the week, but on a net basis, still negative. Looking both ways: 7320 is important due to the GEX at that strike, very close to the 7318 50 EMA. A break below 7300 could ignite a stronger momentum move down toward 7200. Overhead resistance is still roughly similar to what we’ve highlighted all week: 7421-7440 needs to be broken to the upside in order to lessen “da bears” odds of a deeper drop (for now).
Key Levels- bullish over 7440 targeting 7500, then possibly new highs with a retest of the weekly HMA at 7635. Bearish below 7300 targeting 7245 or lower.
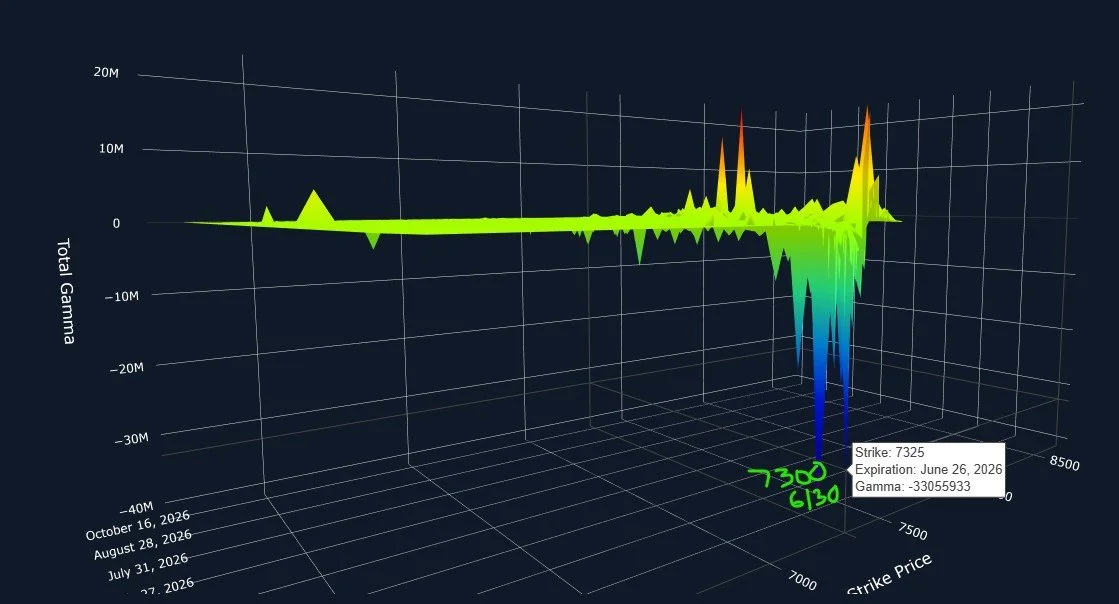
SPX 3D Model: Bearish Now, Bullish Later?
The 3D picture is a bit of a conundrum: Yes, the largest net GEX clusters are all negative, but they aren’t dramatically lower than the lows we’ve already seen, suggesting 7325 has good odds of being reached Friday, and possibly 7300 into June 30. These targets can change quickly, and if they’re going to change, Friday during the cash session would be a strong possibility in terms of timing, so we’ll be watching the GEX picture as the cash session unfolds and we’ll share updates in Discord at the time and in the newsletter prior to Monday’s open.
QQQ- Can Mag 7 Take The Lead As Semis Ease Their Pace?
MU rallied following earnings, and GEX increased relatively at 1250 and 1300 compared to what we saw beforehand. The 1200 area we mentioned yesterday saw initial resistance before seeing a move to the 1255 high of the day. MU also closed just above 1200, though after hours the stock is down over 4% as of the time I’m writing this newsletter.
The question that needs an answer is whether or not the pathetic-looking Mag 7 charts can turn around and help buffer a market that is only being held up by MU? It’s the 3rd largest weighting in the index, but we’ve lost NVDA, MSFT, AAPL, AMZN, many of the other semiconductor names, the list goes on..I would suggest that a contrarian play might be a rotation from the semis back into the beaten-up Mag 7 and software names. The idea that A.I. spending can just happen in a bubble without consequences is a bit simplistic..A.I. needs Mag 7 and software too.
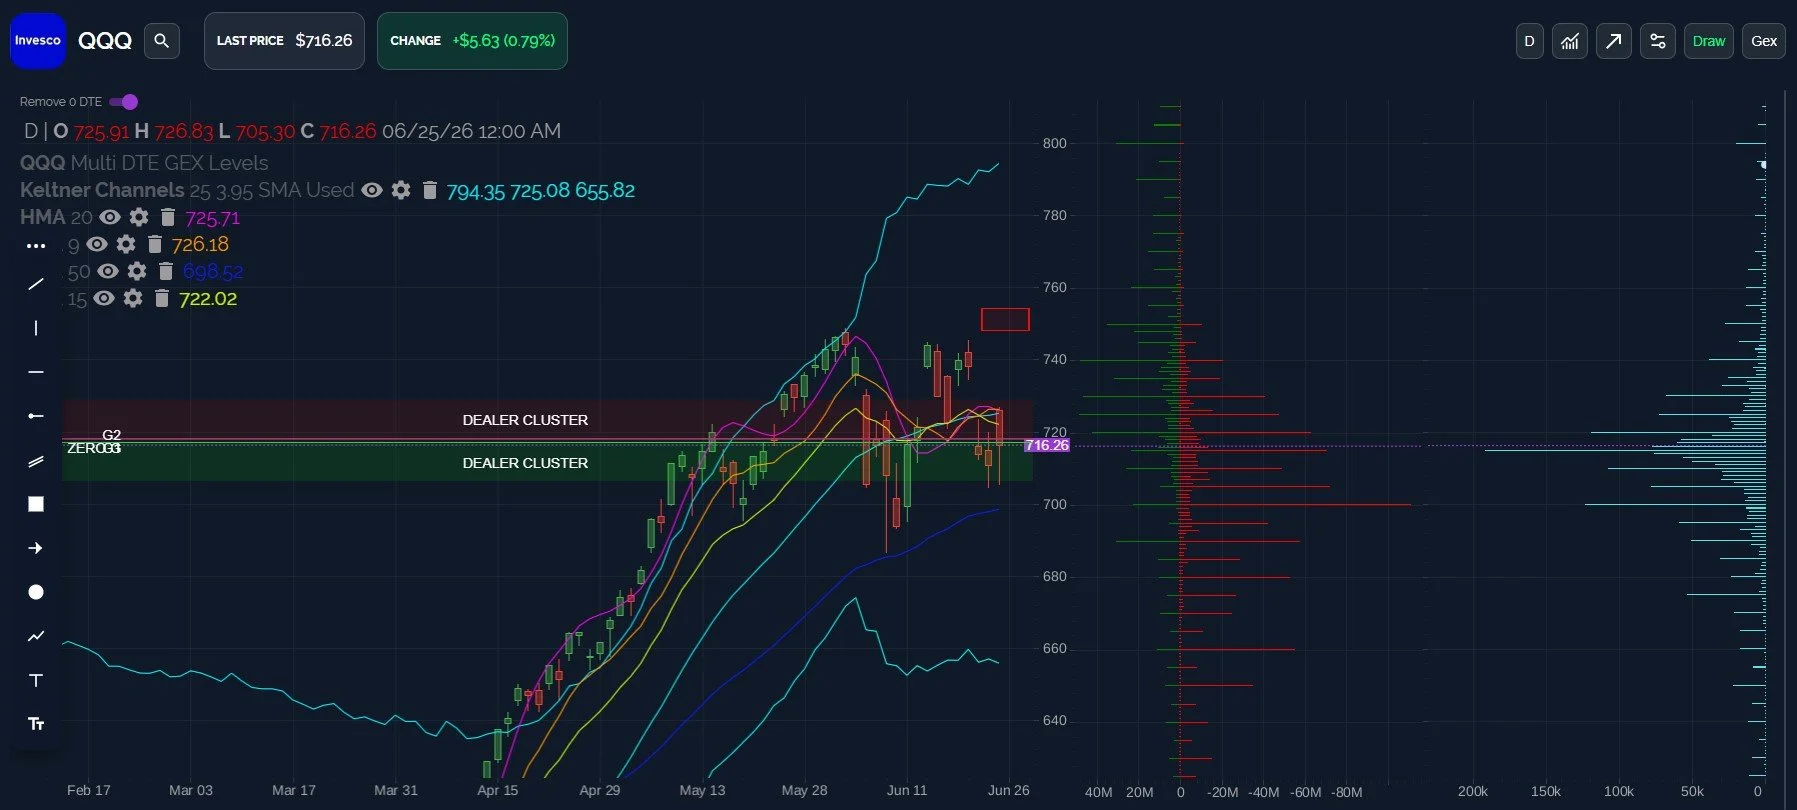
Turning back to the numbers, QQQ’s upper daily Keltner channel is incredibly almost to 800 as it keeps rising. The weekly channel is rising too- now at the 762 mark, with the weekly HMA at 751. I view current risks as follows: QQQ still needs to break out of the 722-727 zone, where all of the moving averages are clustered on the daily chart. This break opens the door to 740-751. A lot of GEX sits at 700-705, but breaking that zone to the downside opens the door to 680, then 660.
Key Levels- Bullish above 727 targeting 740 initially. Bearish below 700 targeting 690, then 680 initially.
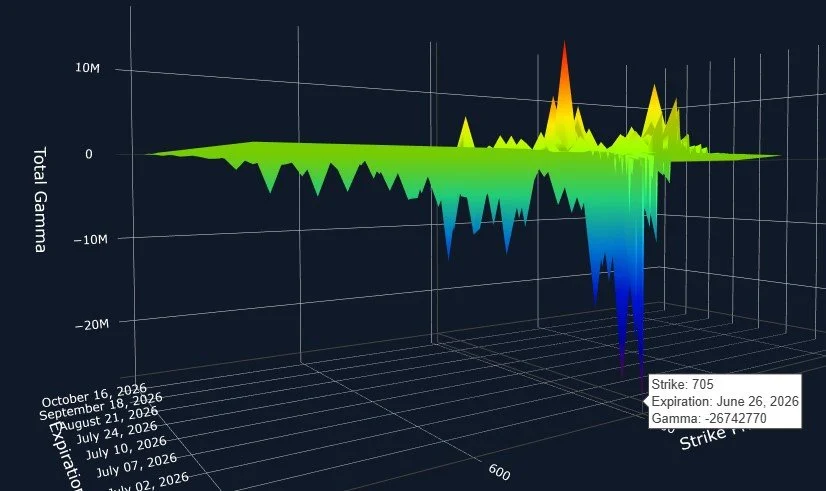
QQQ’s 3D graph suggests we might retest the 705 area tomorrow, which isn’t dramatically lower than where we are, and basically around the area of this week’s low. If QQQ keeps on chopping like this as we enter the last week of the quarter and a normally bullish 4th of July trading day (Thursday, since Friday is a holiday), we may see a whipsaw back up, at least it’s a risk to consider until we receive more information from Mr. Market.
The 2-Hour VIX Maintains A Pathway To 22
The VIX 2-hour chart is holding where it needs to above 18.40, maintaining a possible move higher to the upper Keltner at 22. You may recall that 22 is also a big GEX area, so there’s some confluence at that level.
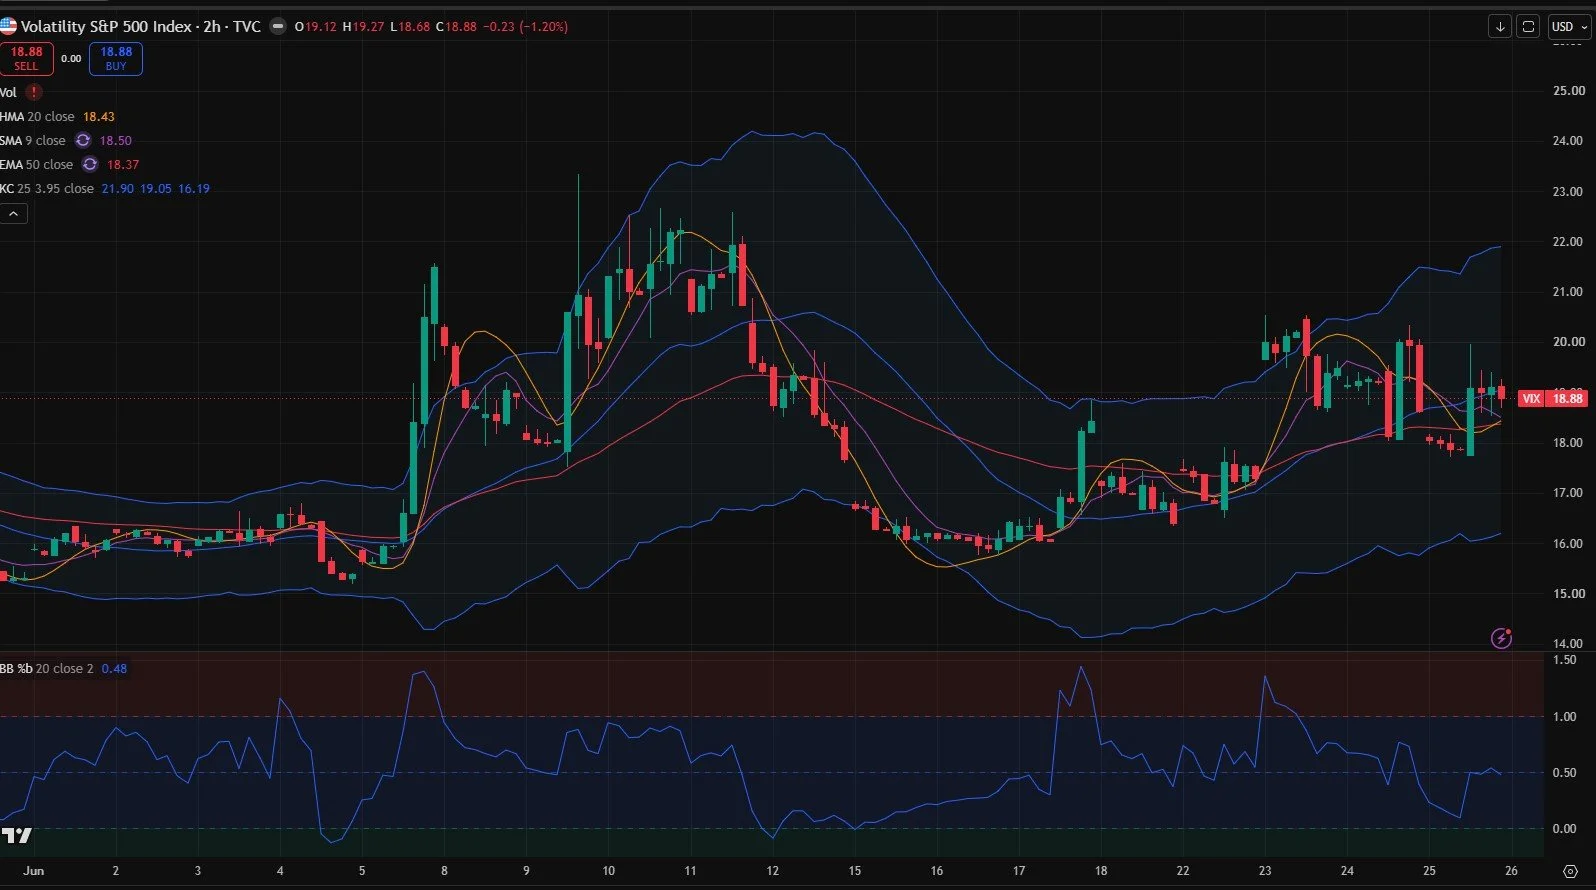
The VIX Needs To Lose 17.5 To Have a Shot At 15 Again
The daily chart also looks bullish for volatility above 17.5, and today’s low at 17.77 was a nice retest of the HMA that held so far. The GEX picture suggests 20 is an important pivot that may help catalyze a move toward 22-25, which may imply indices reach lower levels than the GEX picture currently suggests for SPX and QQQ, so we’ll be watching any divergences or changes between the VIX and the broader indices we follow.
Key Levels: Bullish (for the VIX) above 17.5, targeting 20, then 22-25. Bearish below 17.5, targeting 15.5.
Join The discussion
Tonight’s YouTube video discusses SPX, AMD, MU, NVDA, INTC, PANW, BTC, and the VIX, so check it out if you have a few minutes! This video and prior videos can be viewed by clicking Community at the top of our homepage to find our YouTube channel link. We will also try to conduct our usual livestream Thursday!
Non-subscribers can join through Community on our homepage. First-time guests get a free 7-day trial of the premium Discord channels, where we talk through what is happening in real time.
We run a livestream from the homepage every day around 10:30am ET, and you can replay the most recent one any time before the next.
Thanks for being part of our community and know that we invite and appreciate your feedback!
The information provided by Geeks of Finance LLC is for educational purposes only and is not intended to be, nor should be construed as, an offer, recommendation or solicitation to buy or sell any security or instrument or to participate in any transaction or activity. Please view our Investment Adviser Disclaimer and Risk Disclosure.