
Awaiting Clues On SPX, 7600 Still Likely
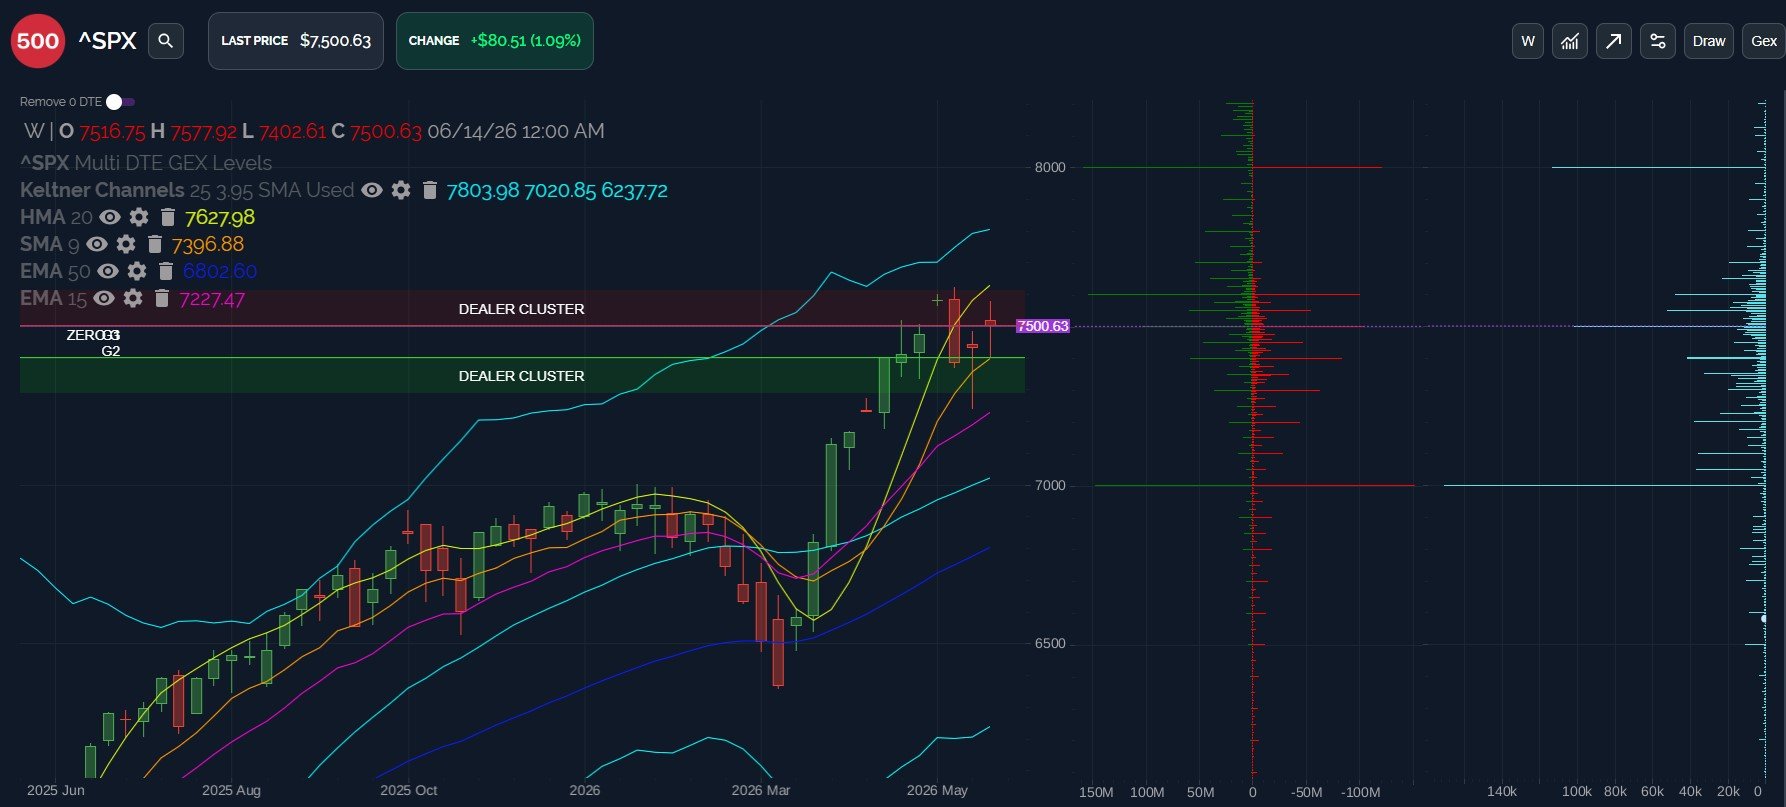
SPX closed at exactly 7500 Thursday, a bullish move of almost 100 points from the prior day’s close. This OpEx week ended up with a bit more volatility than some may be accustomed to. Strangely, we just completed two weeks where SPX closed higher than the previous week, but lower than the opening trade for the week. And you thought futures traders did the heavy lifting before these last two weeks. The upcoming July OpEx cycle starting next week may clue us in as to whether or not major participants have been offloading inventory during cash sessions. GEX still leans bullish, and we’re above the 7400 pivot area.
Members save $300 on the annual Portfolio Manager plan with code SUMMERHODL at checkout, which will run a few more days.
SPX: 7400 Make Or Break
As we enter the July OpEx cycle, we are looking at 3 important GEX areas: SPX 7000, 7600, and 8000. These are not necessarily the largest net GEX clusters, but they’re the largest areas of both positive and negative GEX, marking important resistance/support areas. At this moment, and subject to potential change as soon as Monday, we see 7600 represented well for next week, with 8000 scattered across various expirations but primarily in September and beyond. What might we conclude from that? I think 7600 may be reached again next week, but there’s a lot that can happen between next week and several months from now. SPX is below the weekly HMA and we don’t see much GEX between 7600 and 8000, so SPX needs to hold above 7600 to increase the odds of reaching those various strikes in between. Odds currently favor consolidation around 7600, which may include another pullback. We can entertain scenarios that include 7000 if we see SPX lose 7400 again.
Key Levels: Bullish over 7500 targeting 7600. 7400-7500 chop zone. Bearish below 7400 targeting 7300, then potentially 7000.
SPX Shows A Variety Of Possibilities Next Week
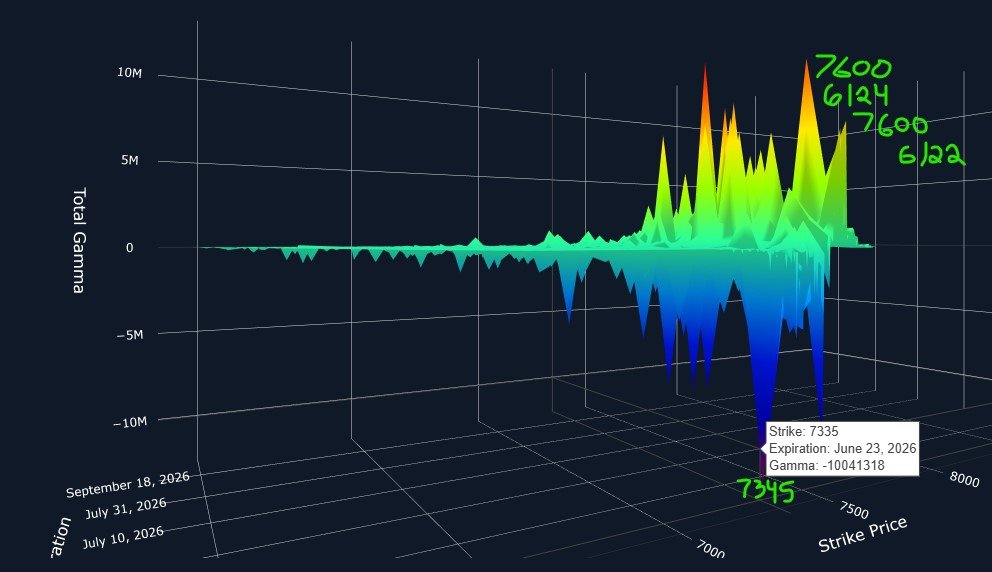
A granular look at SPX’s 3D graph shows 7335-7345 as the largest individual GEX clusters expiring June 23, certainly raising the possibility of a drop to that level. But a new set of GEX clusters arrived today, ranging from 7575 up to 7600, with expirations anywhere from Monday to Wednesday. I highly doubt we will see 7335 and 7600 in the same day, but I guess anything is possible. A more likely scenario may involve heightened volatility next week: 1-2 days where the market is down a lot, then another 1-2 days where we rally back up (not in that particular order). Stay on your toes and we’ll consult the 0 DTE picture each morning once the cash session starts to better assess what’s likely.
QQQ : Solely Driven By The Semis, Weakness Under The Surface
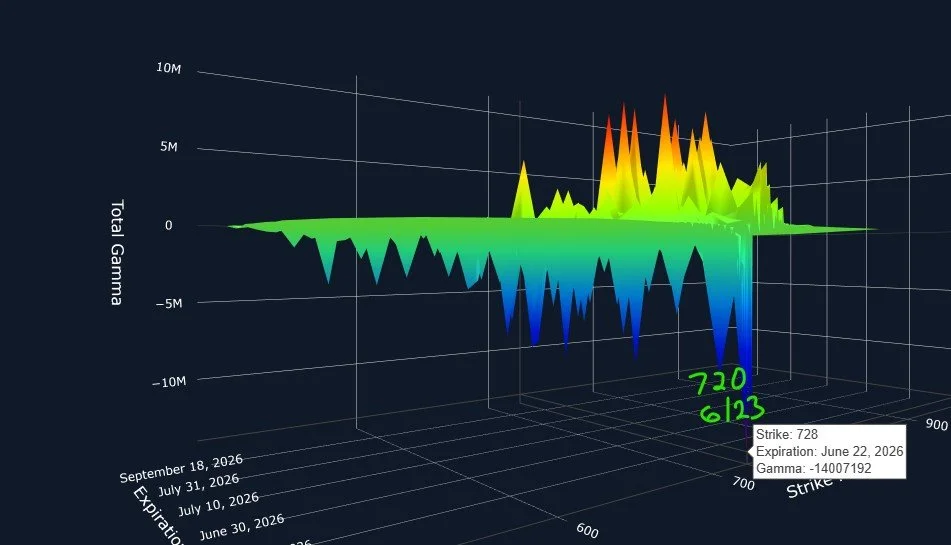
While SMH can’t find a top, software names and even most of the Mag 7 can’t seem to find a bottom. I find it unusual to see such narrow participation within technology itself, but hey, everything about the environment this year has seemed unusual. On a serious note, I notice QQQ shows relatively more GEX at 800 than we’ve seen before, which is interesting. In the near-term, The upper weekly Keltner may continue to act as resistance alongside the lack of a lot of GEX above 750 for QQQ. The odds look favorable for an eventual tag of 800, but it might take some time. QQQ is also below its weekly HMA and it’s far extended above its daily HMA, which is near 720. 720 is likely to remain an important strike going forward, with 700 as the target below. Current momentum may favor a tag of 750.
Key levels: Chop zone between 730-739. Bullish over 740 targeting 750. Bearish to 700 below 720.

QQQ Also Illustrates Bearish Potential For Part Of Next Week
QQQ’s largest net GEX cluster expiring Monday is at 728, and Tuesday’s largest net cluster is at 720, potentially suggesting early weakness. If we do see weakness, it shouldn’t be surprising after the big move this week, though I think the context is likely a “buy the dip” environment unless QQQ loses 700.
The VIX: Holding Up Relatively Well
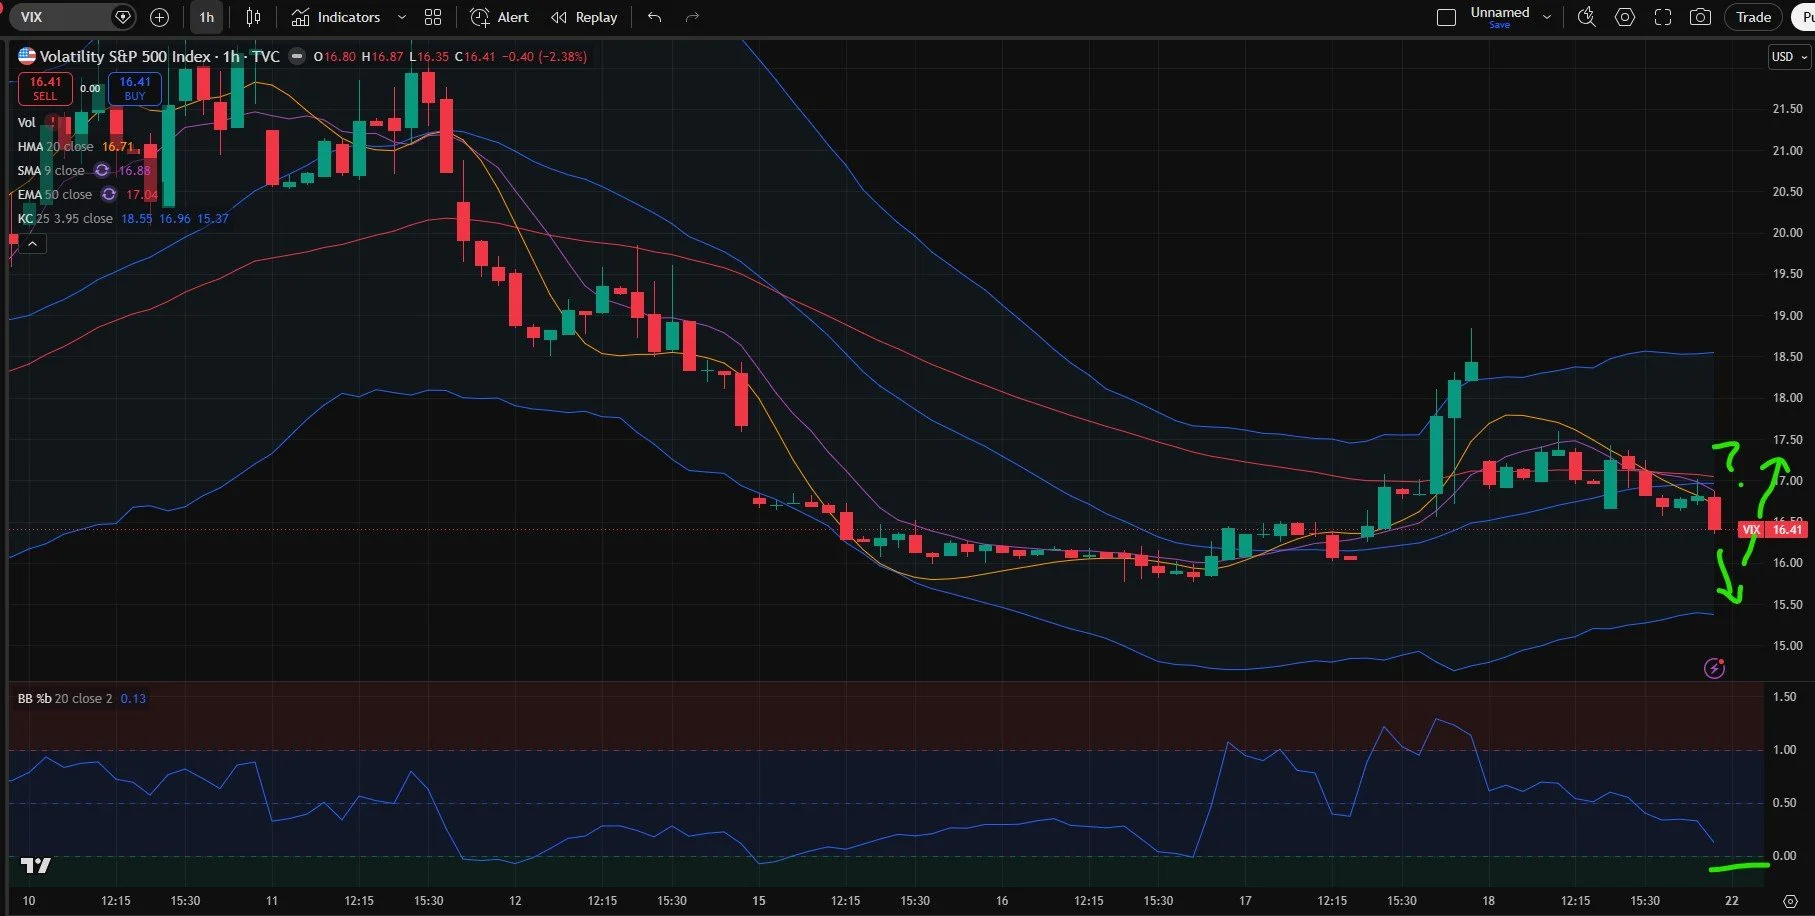
Some timeframes on the VIX look indecisive, but if we look at the 1-hour and 2-hour charts, we see early signs of shifting momentum to the upside for the VIX, as indicated by the Keltner channels and the big spikes upward followed by a “trickle” back down. The 1-hour chart below shows the %b indicator already back to oversold territory as the reading approaches 0.0 again. We could see the VIX continue lower along the HMA toward the lower Keltner at 15.5 (remember, that’s also near the weekly HMA), though the current setup would allow for an immediate spike from here as well, with a retest of 20 entirely possible. "Let’s see what Monday brings in terms of the VIX, which may help provide context for the broader indices as well.
Key Levels: Likely limited downside below 15. Bullish above 17 targeting 20, then 22, then 25.
Enjoy the holiday on Friday and we will see you next tweek!
Join The discussion
Tune in Sunday evening for our next YouTube video (no newsletter Sunday)! This video and our prior videos can be viewed by clicking Community at the top of our homepage to find our YouTube channel link.
Non-subscribers can join through Community on our homepage. First-time guests get a free 7-day trial of the premium Discord channels, where we talk through what is happening in real time.
We run a livestream from the homepage every day around 10:30am ET, and you can replay the most recent one any time before the next.
Thanks for being part of our community and know that we invite and appreciate your feedback!
The information provided by Geeks of Finance LLC is for educational purposes only and is not intended to be, nor should be construed as, an offer, recommendation or solicitation to buy or sell any security or instrument or to participate in any transaction or activity. Please view our Investment Adviser Disclaimer and Risk Disclosure.