
QQQ Approaches Resistance (Again): May 8 Stock Market Preview
Technical Glitch (un)Appreciation Week continues as unforeseen and changing roadblocks get in the way of posting our recorded YouTube video, but you can view our library of previous videos by clicking Community at the top of our homepage to find our YouTube channel link! I think there’s a saying about problems coming in threes? Or maybe that’s an Elliott Wave principle, either way…
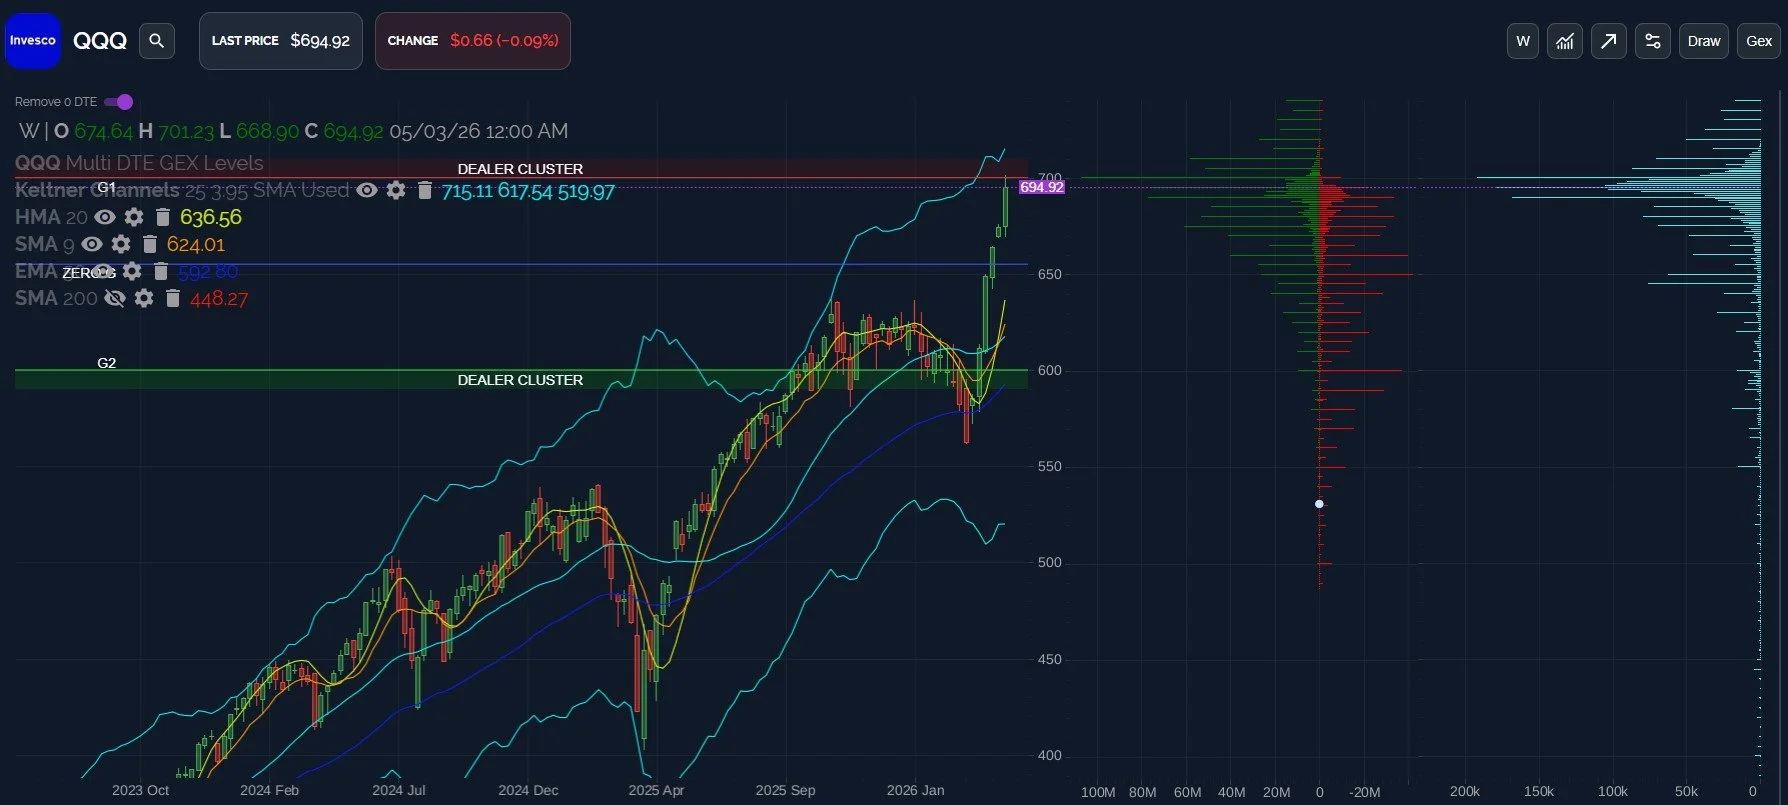
QQQ reached a high of 701.23 today, inching closer to the 710-715 zone that represents confluence of the last larger GEX clusters and the upper weekly Keltner channel.
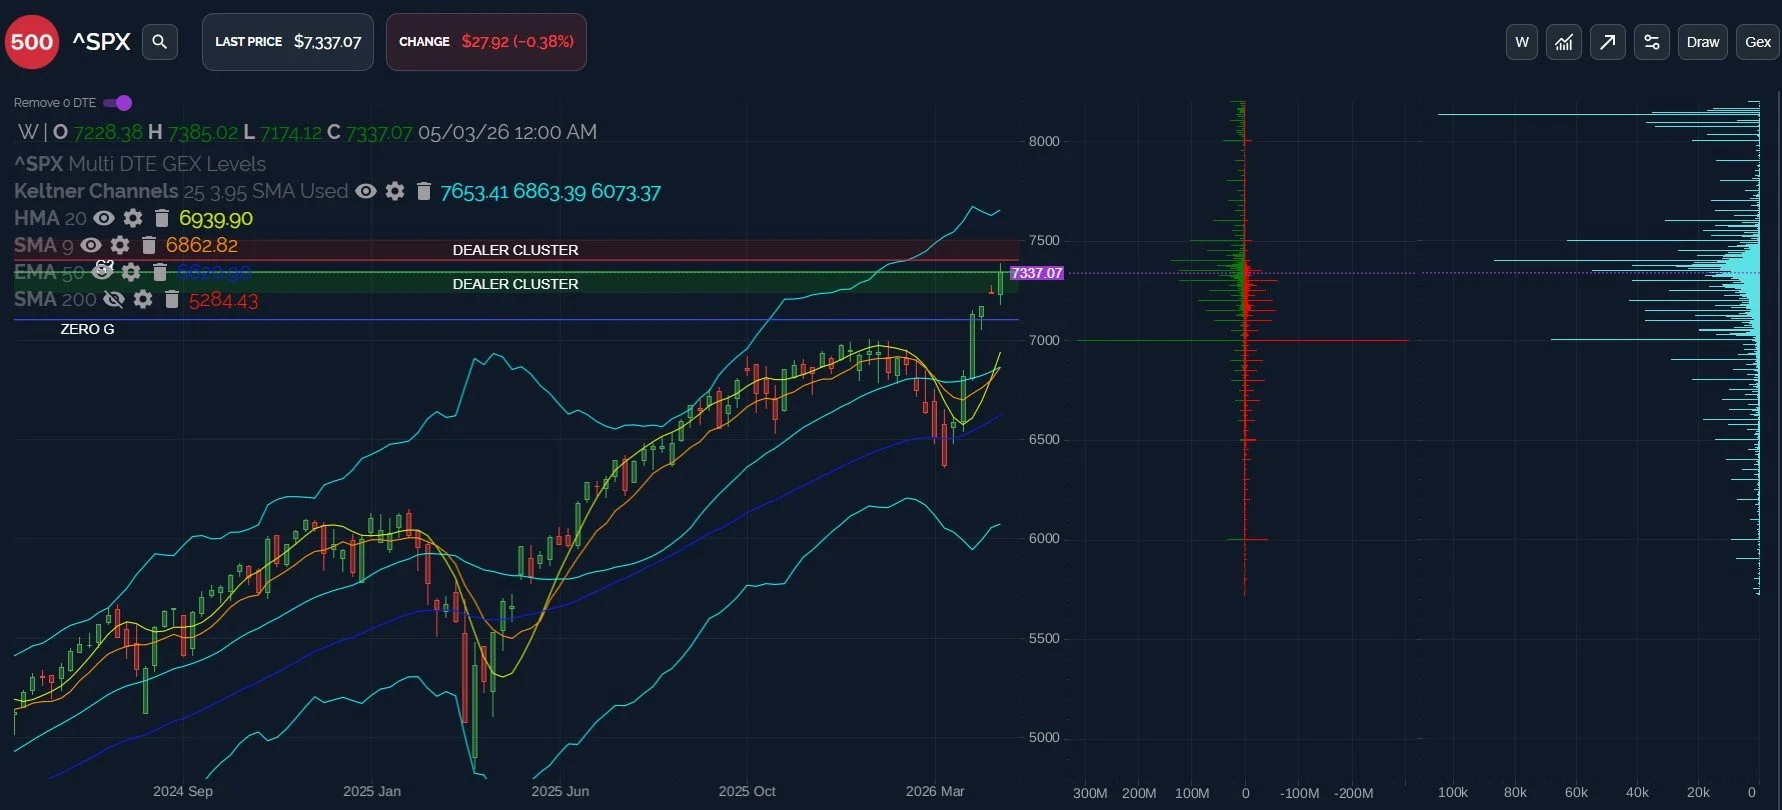
Volume continues to be elevated at the 645-650 strikes, as well as the SPX 7000 strike, areas that might come into play in the event of what we used to call a “pullback” materializing.
I still like the idea of retracing to the near-vertically rising HMA near an anticipated 645-650 as an optimistic case, as that would preserve the parabolic rally, though the largest net negative GEX cluster (our lower Dealer Cluster zone) is at 600, which would certainly invoke some seasick responses from newly converted bulls with a memory spanning 30 days.
I still think SPX’s weekly upper Keltner is far less likely as a near-term target than QQQ’s, but there’s nothing bearish about the current trend and the direction of the underlying indicators.
We can also point to the volume at 8130 (which I’m assuming is either Tom Lee or Jeremy Siegel himself) as a hyper bullish upside target which actually may come into play later.
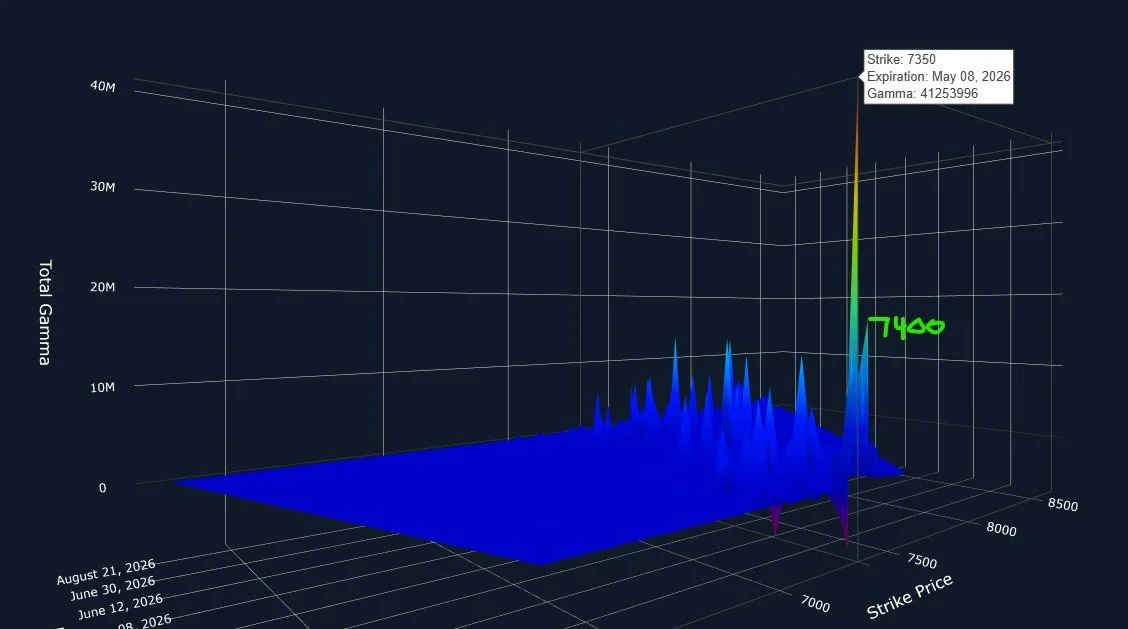
In the short run, I think an incremental higher high for SPX is possible and fitting with the idea of QQQ reaching 610-615, followed by a pullback toward the 7000 area. GEX really dies off after 7500, so being wrong may mean stretching a bit higher than 7400, and the upper Dealer Cluster zone certainly gives merit toward another 2% higher before a more meaningful pullback.
Tomorrow’s largest net GEX clusters for SPX are at 7350 and 7400, though there’s quite a disparity between the two, in terms of GEX size. We’ll consider new information post-open tomorrow to better assess the odds of where we go during Friday’s trading session.
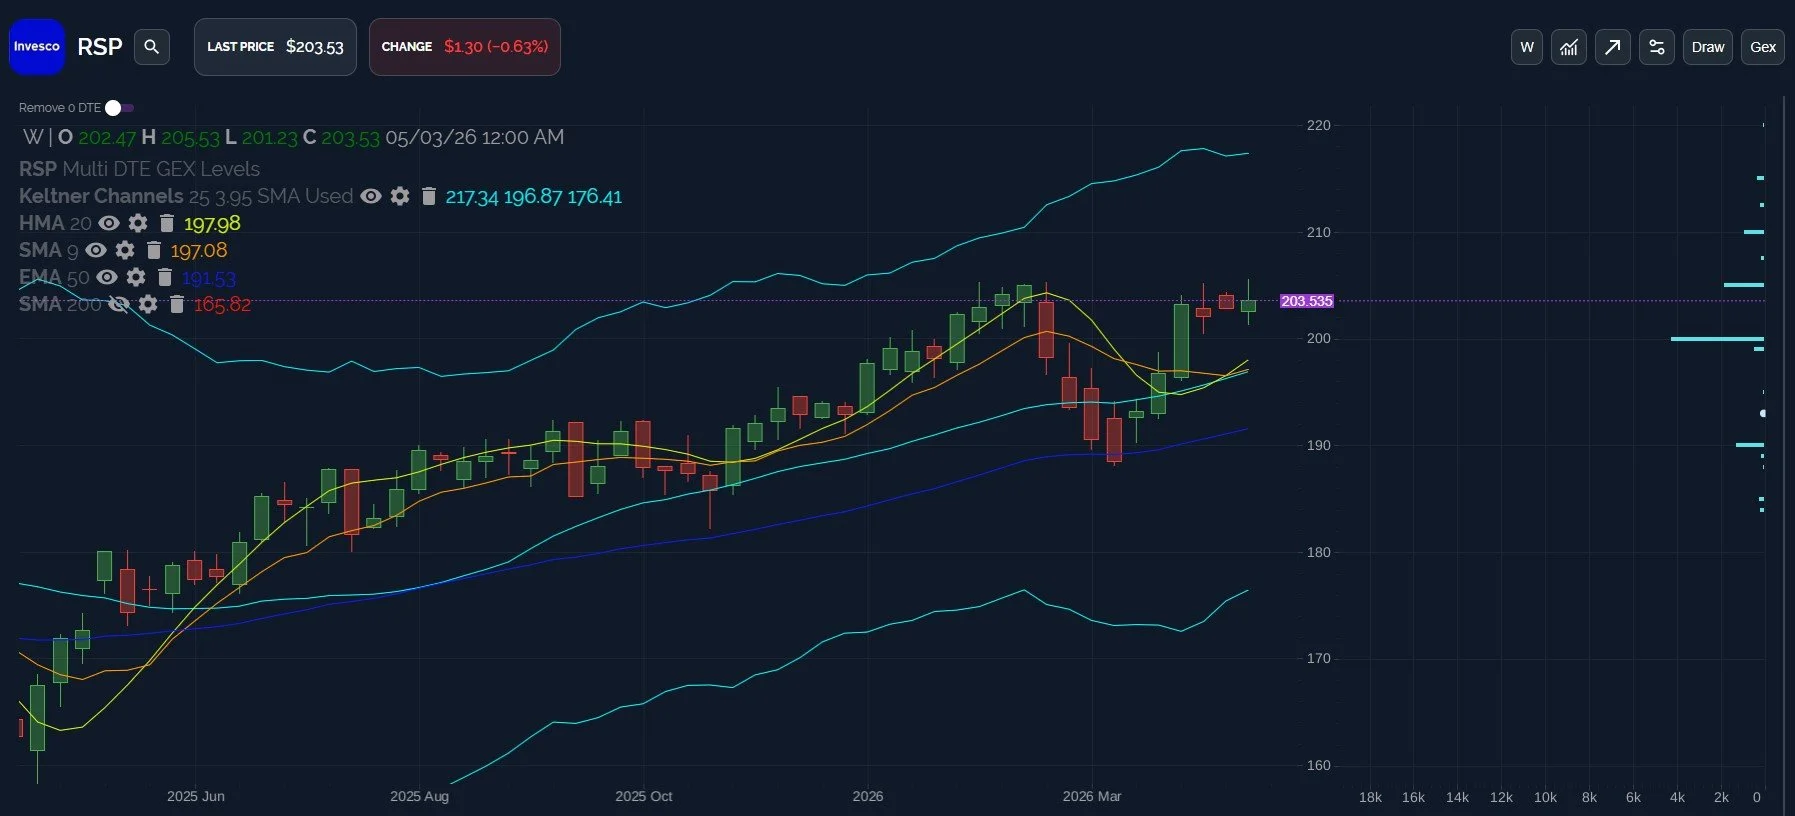
A chart we will share for context: RSP, the equal-weight S&P. Today was a new high, though we didn’t close at a new high, and you can see the chart is virtually sideways since February. Sad state of affairs for anything but semiconductors.
Assigning meaning to this chart involves two primary conclusions, in my view: Either a negatively divergent pattern that implies other indices may drop (bad breadth playing out), or perhaps a rotation could occur from semiconductors toward the beaten up sectors that haven’t participated in the rally. Watching this chart is not a primary activity or consideration for me, but it’s something to consider, especially if we see RSP head back toward 200, which may be an area to buy.
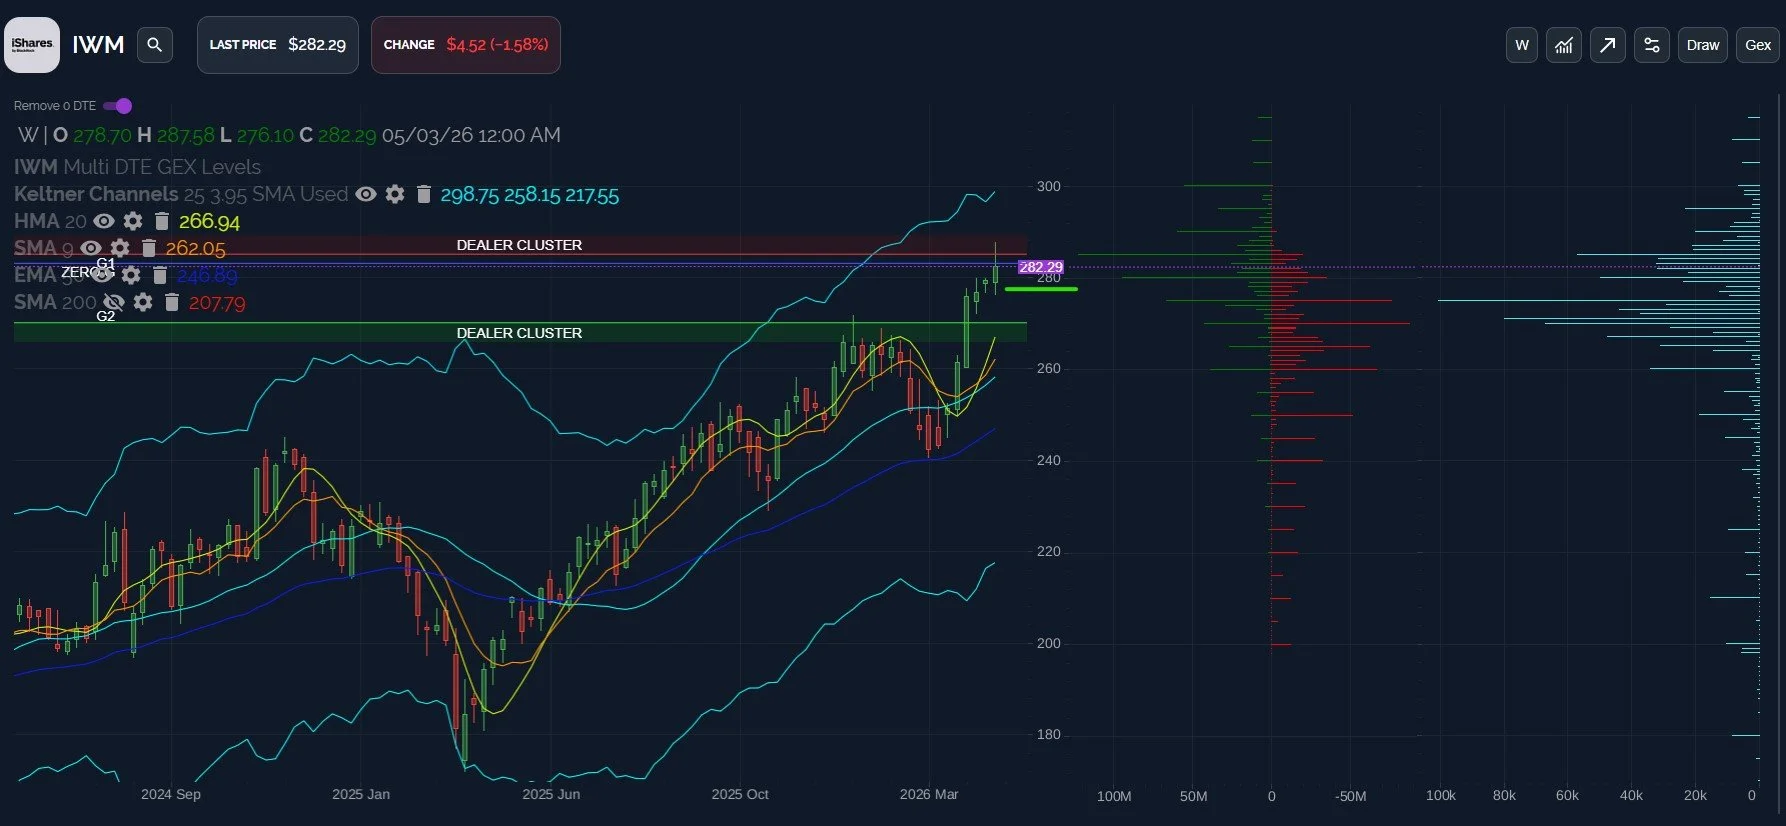
IWM fell the most today, yet IWM also seems to have the greatest upside, if we consider the same indicator levels that we’ve considered for SPX and QQQ as potential targets.
A drop below 281 (the daily HMA) may imply a visit to the weekly HMA near 267-270, though 300 looks like a realistic upside target as well. In these circumstances, I would rather react to whichever level is reached first, though a number of approaches exist to trading such possibilities.
Thanks for reading, we hope you’ll join us in Discord to continue the discussion!
To enter Discord as a non-subscriber, go to our homepage and click on Community to enter our Discord server! First-time guests receive a free 7-day trial of the premium Discord channels and this is where we discuss what’s happening in real-time.
We conduct a livestream that is accessible from our homepage every day around 10:30am ET, so feel free to join us there. You can also listen to our most recent livestream any time before the next day’s livestream occurs.
Thanks for being part of our community and know that we invite and appreciate your feedback!
The information provided by Geeks of Finance LLC is for educational purposes only and is not intended to be, nor should be construed as, an offer, recommendation or solicitation to buy or sell any security or instrument or to participate in any transaction or activity. Please view our Investment Adviser Disclaimer and Risk Disclosure.