
QQQ Weekly Chart In Play? May 6 Stock Market Preview
Get $300 off of the annual Portfolio Manager subscription by entering the code TAXES2026 at checkout! This will only last a few more days!
We’re still resolving technical issues tied to our YouTube recordings, so there’s no video for Tuesday night, but you can view our library of previous videos by clicking Community at the top of our homepage to find our YouTube channel link. We’ll be back tomorrow!
Ground Hog Day continues: The market is up, volume is heavy at 7000, and bizarre divergences are present. Welcome to Fantasy Land, where indices are locked into a constant parabola higher, and “Downside” is a relic of the past, a concept taught in virtual history classes.
SPX in particular is technically overbought and above all of the indicators on my chart, signaling strong momentum, yet also displaying conditions previously associated with pullbacks.
The GEX picture is positive, with notable GEX between 7300-7500, though price has rejected twice from the lower edge of the upper Dealer Cluster zone (so far).
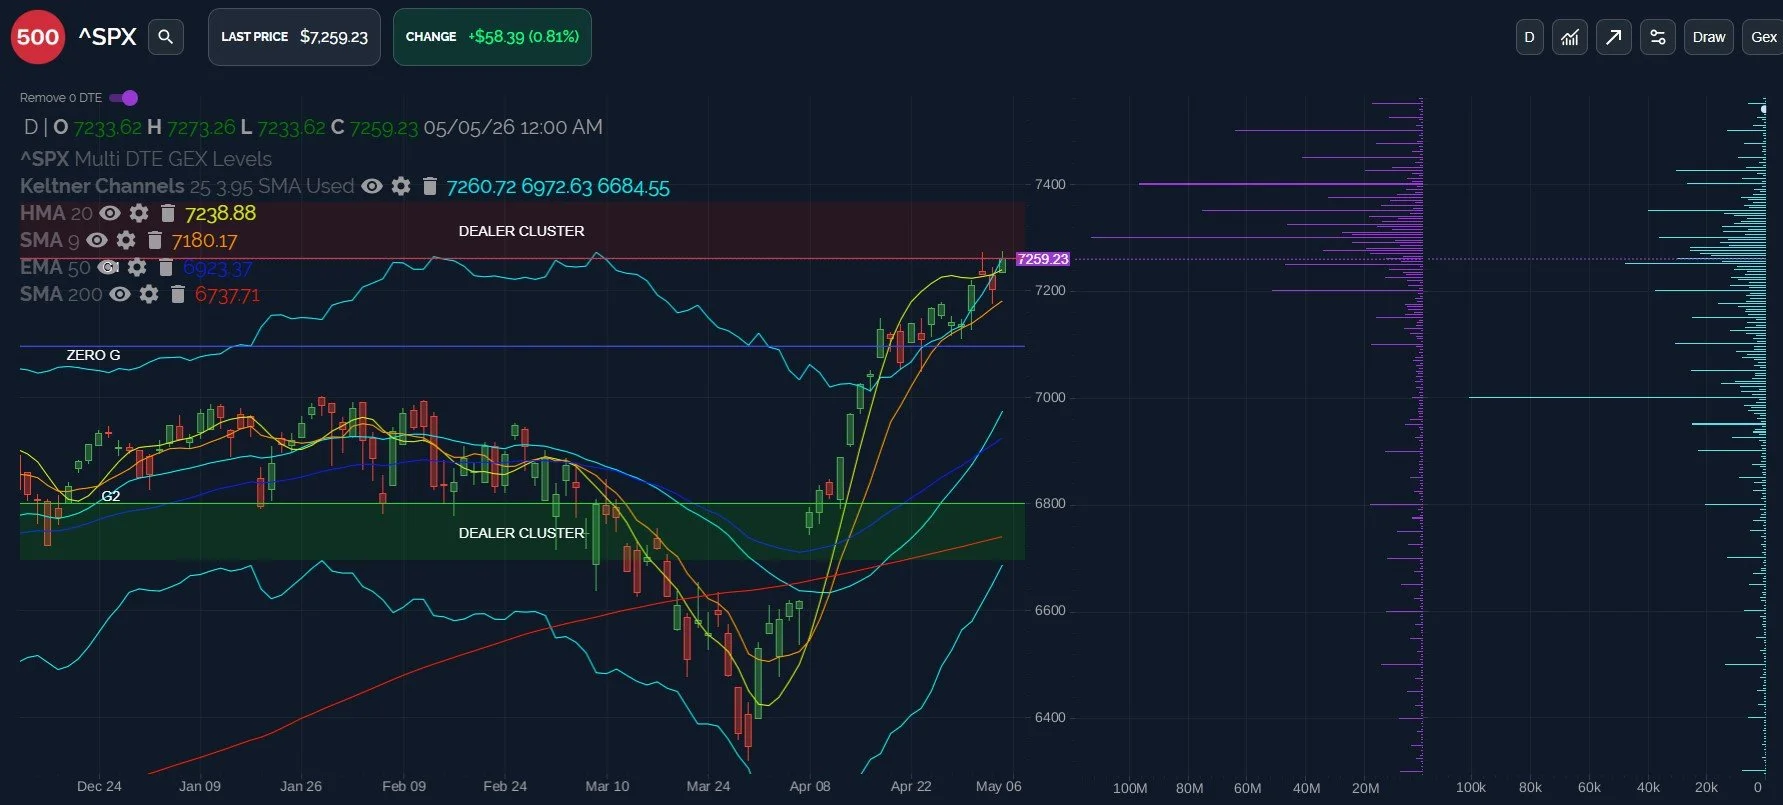
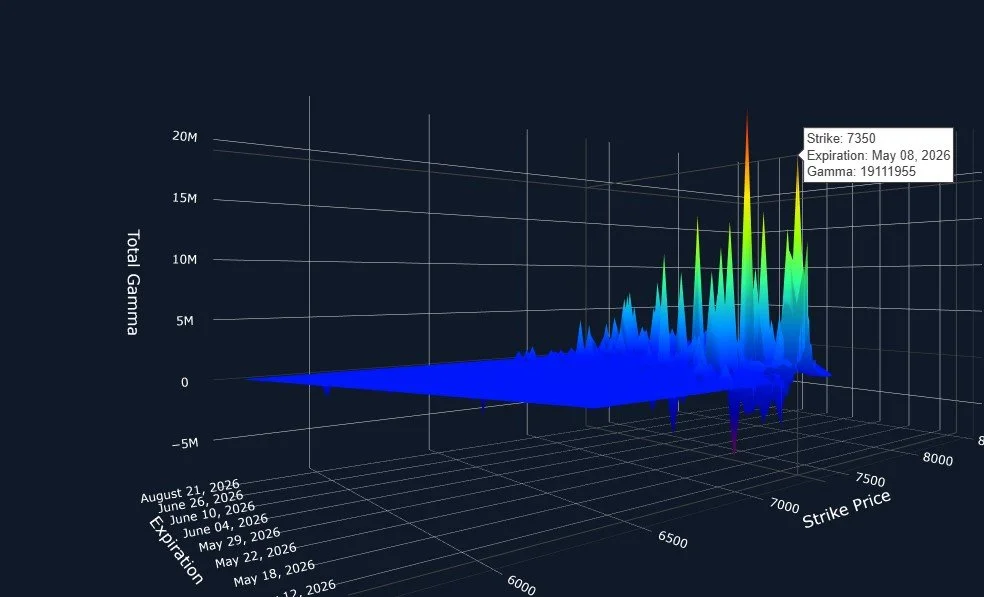
While QQQ doesn’t show meaningful GEX at higher prices, SPX is still displaying mostly positive GEX into the end of the week, including the largest net GEX cluster at 7350.
Given that 7350 is barely 1.5% away, I think the current momentum certainly makes 7350-7400 possible, though those areas still represent a big extension beyond my indicators, favoring a near-term pullback.
Big tech names have not been consistently bullish lately, the momentum is mostly in the semiconductors within the Nasdaq. Might QQQ’s weekly Keltner channel come into play? The move higher has been incredible, and the odds of reaching the upper Keltner at 707 seem low to me, but it’s always possible with an emotional rally like we’re seeing. Note that the upper Keltner is also declining, interestingly.
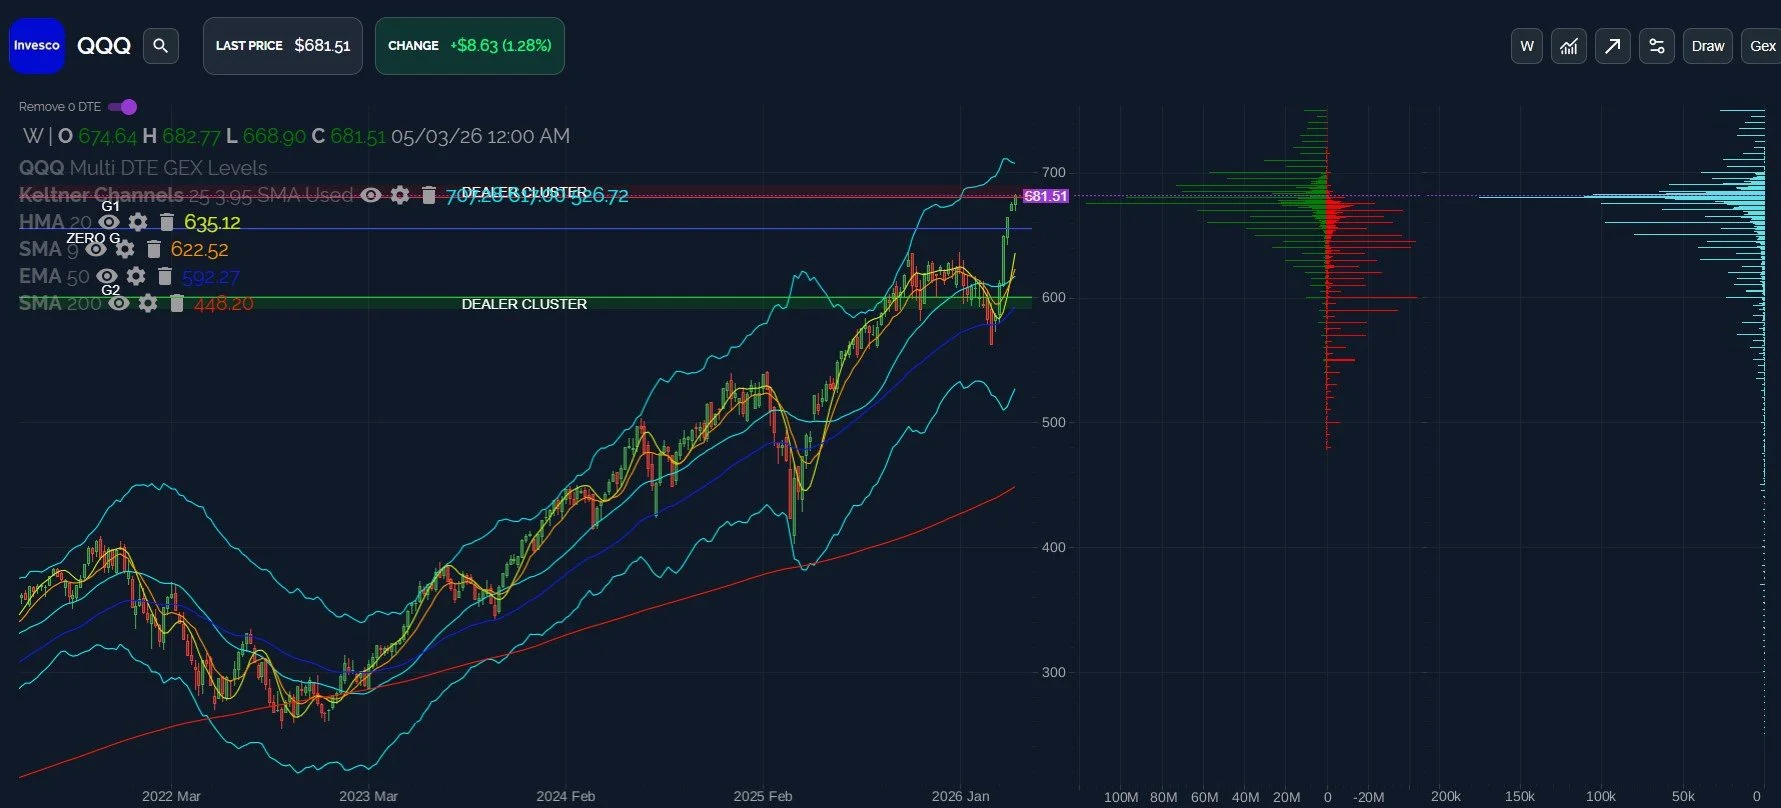
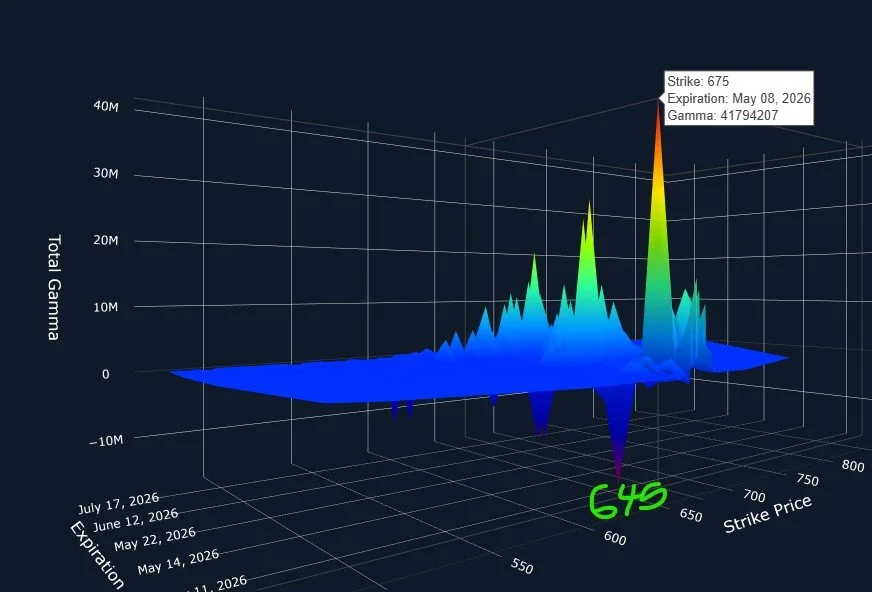
QQQ has a slightly different GEX picture than SPX, with the largest net clusters existing below the current price. Which GEX picture will prove to be more correct- the 7350 SPX picture, or the 645-675 QQQ picture?
Is the next question whether or not MU can rise 10% every day? I certainly don’t find it bullish that the incremental new highs are now requiring 1-2 semis to be up 10-15% daily, that sort of a move is typically associated with blow-off moves. These aren’t penny stocks, but they’re trading that way.
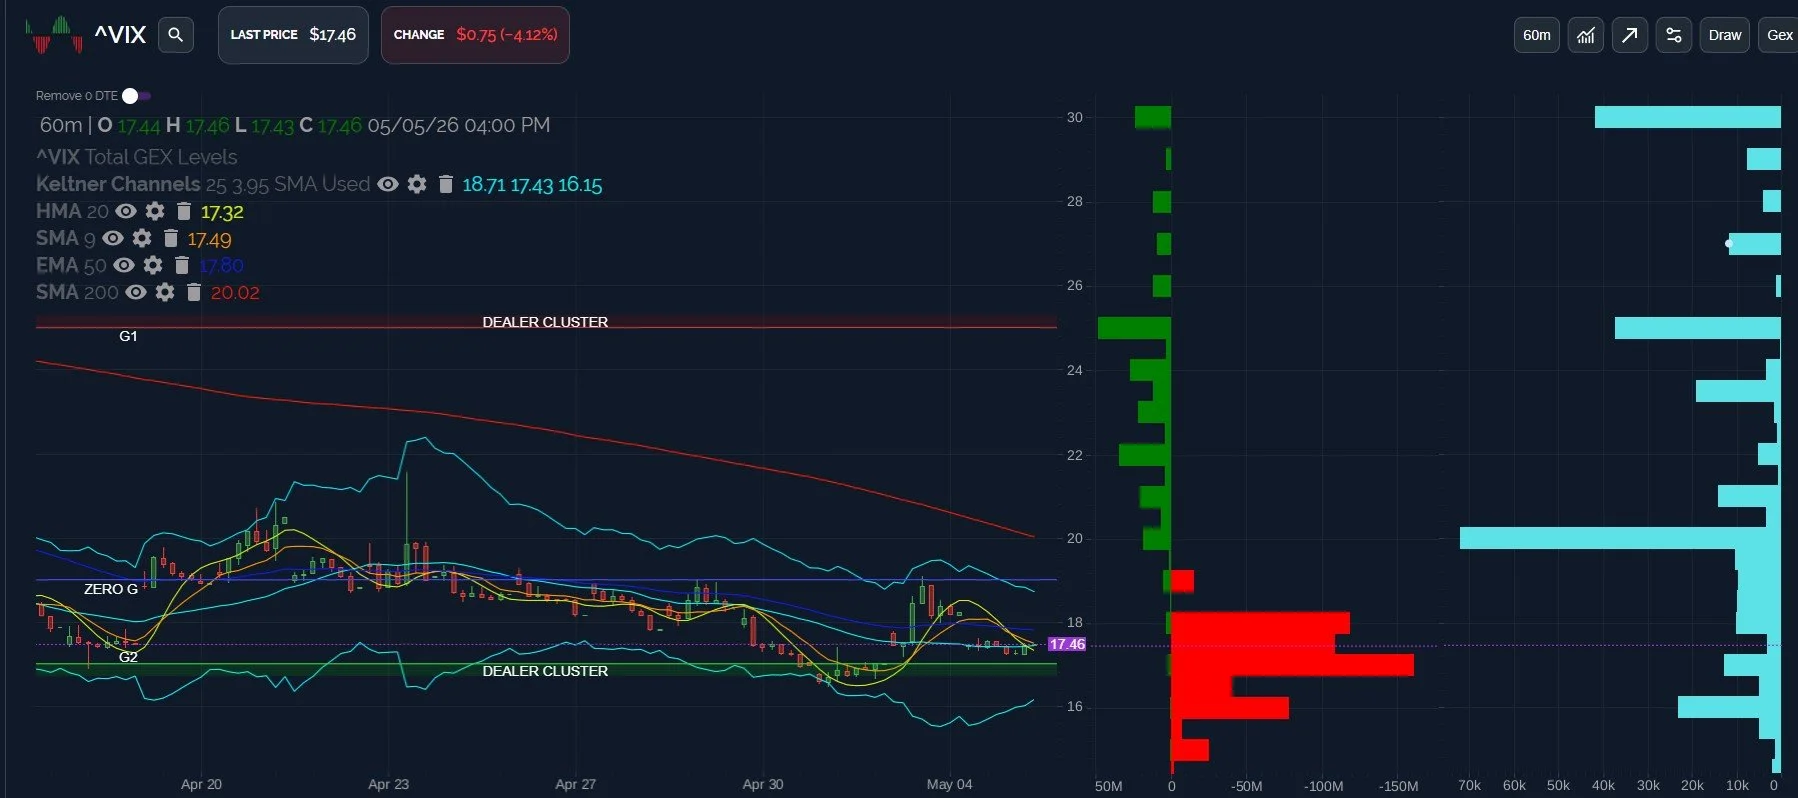
The VIX daily and weekly charts mostly look bullish for markets, which is good. But we still believe an imminent pullback is near, and smaller timeframes appear close to a turn, including the VIX 1-hour chart shown below.
GEX above 18 quickly turns positive, with 25 being the prominent positive GEX target, if a pullback materializes and surpasses the 20 strike.
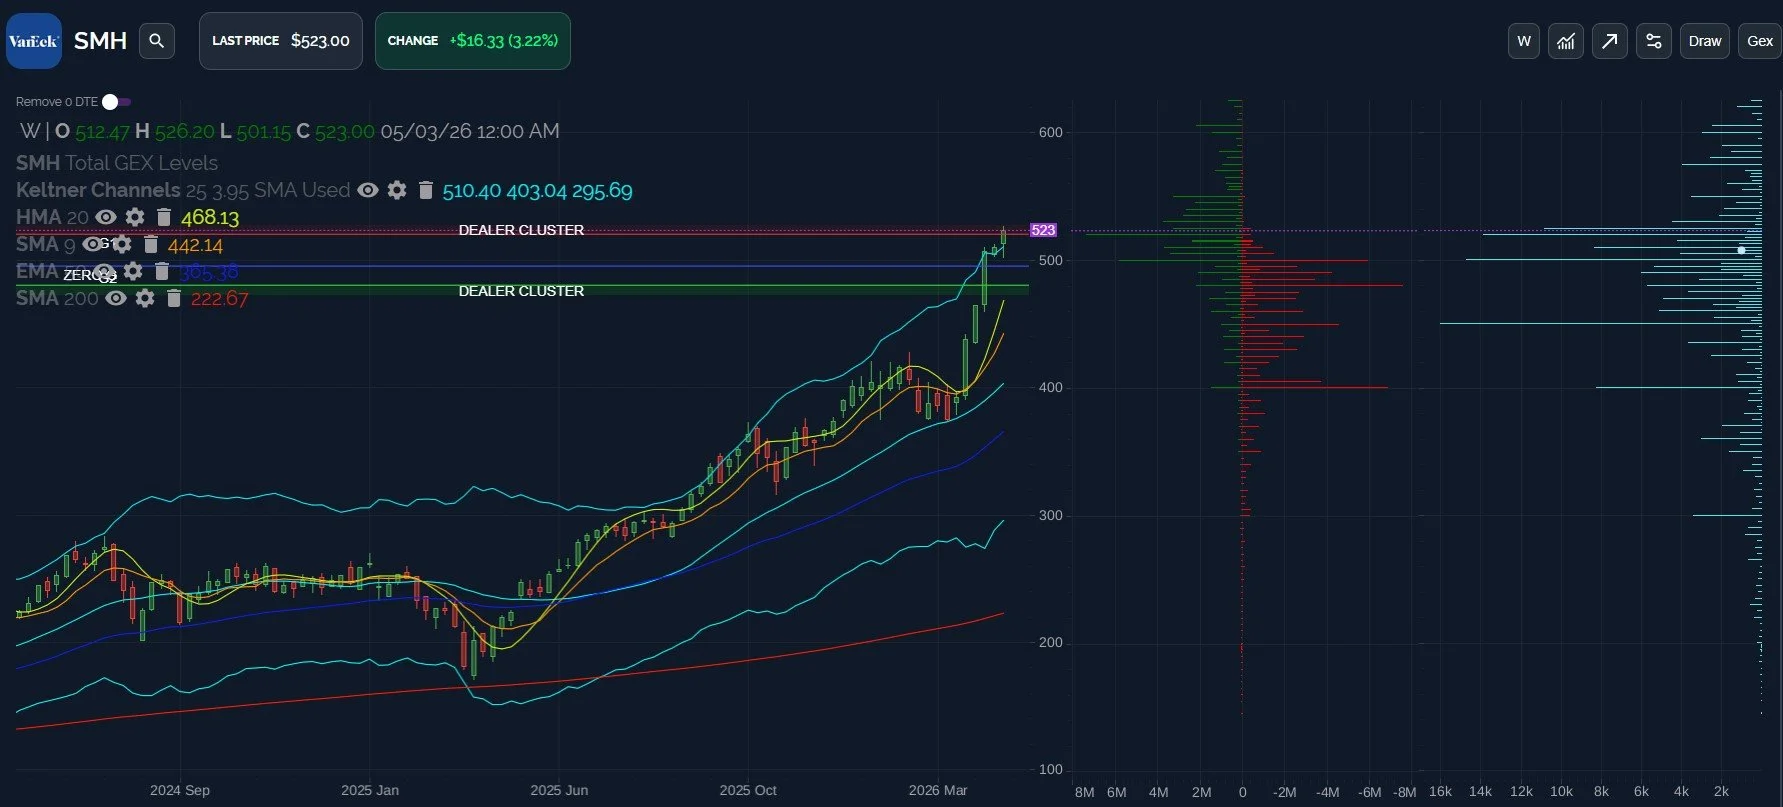
SMH showed meaningful GEX at 520 as of last week, and amazingly, we’ve reached that in a straight line. We are now at a point where we don’t see much in terms of really large positive clusters beyond today’s closing price, and SMH is well above the weekly Keltner, so maybe we’re finally close to a nice pullback.
We invite you to join us in our discussion in Discord tomorrow, where we’ll share extra in the general chat. We appreciate your participation!
To enter Discord as a non-subscriber, go to our homepage and click on Community to enter our Discord server! First-time guests receive a free 7-day trial of the premium Discord channels and this is where we discuss what’s happening in real-time.
We conduct a livestream that is accessible from our homepage every day around 10:30am ET, so feel free to join us there. You can also listen to our most recent livestream any time before the next day’s livestream occurs.
Get $300 off of the annual Portfolio Manager subscription by entering TAXES2026 at checkout!
Thanks for being part of our community and know that we invite and appreciate your feedback!
The information provided by Geeks of Finance LLC is for educational purposes only and is not intended to be, nor should be construed as, an offer, recommendation or solicitation to buy or sell any security or instrument or to participate in any transaction or activity. Please view our Investment Adviser Disclaimer and Risk Disclosure.