
QQQ Weekly: As Stretched As It Gets? May 4 Stock Market Preview
Get $300 off of the annual Portfolio Manager subscription by entering the code TAXES2026 at checkout! This will only last a few more days!
Tonight’s YouTube video covers SPX, the VIX, PLTR, and AMD, so check it out if you have a few short minutes! We also take a look at the AAII survey and more. You can view this video and our library of previous videos by clicking Community at the top of our homepage to find our YouTube channel link.
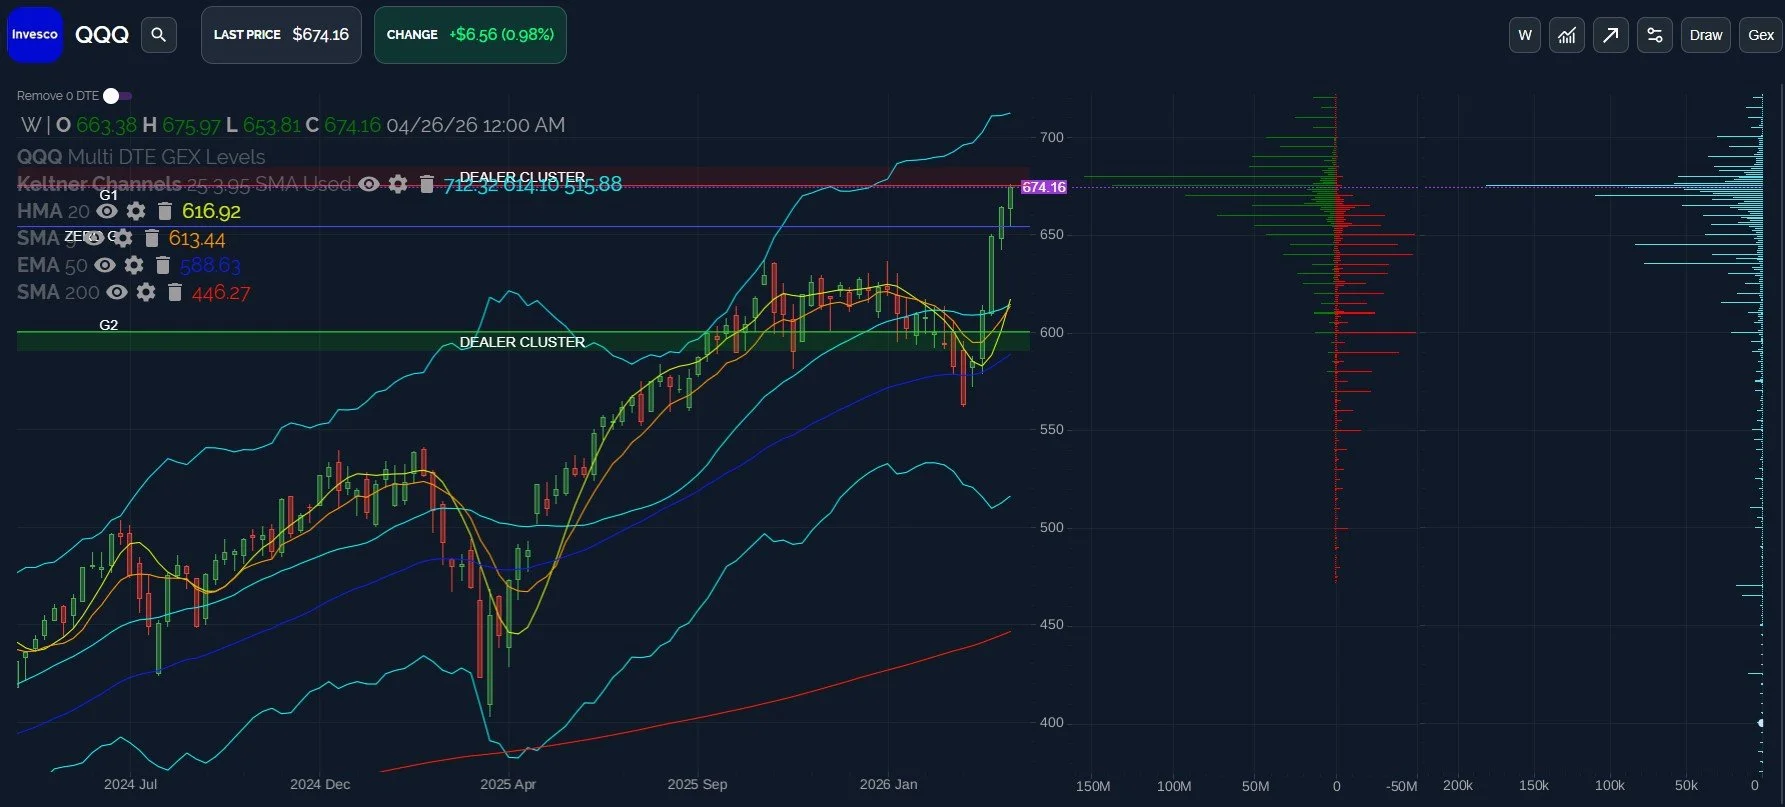
Let’s start with a look at the weekly chart for QQQ: A quick glance at just the last two years (and earlier, though not reflected on the selected timeframe) reveals that QQQ is far extended beyond a variety of moving averages compared to most weeks.
While the weekly Keltner channels have marked reversal areas surrounding price extensions in the past, the upper weekly Keltner is at 712, quite some distance from the current price, which is already looking extreme.
Before we move on to a more zoomed-in look at the daily chart, note that the GEX picture shows a rapid tapering off of GEX clusters beyond 680 (for now).
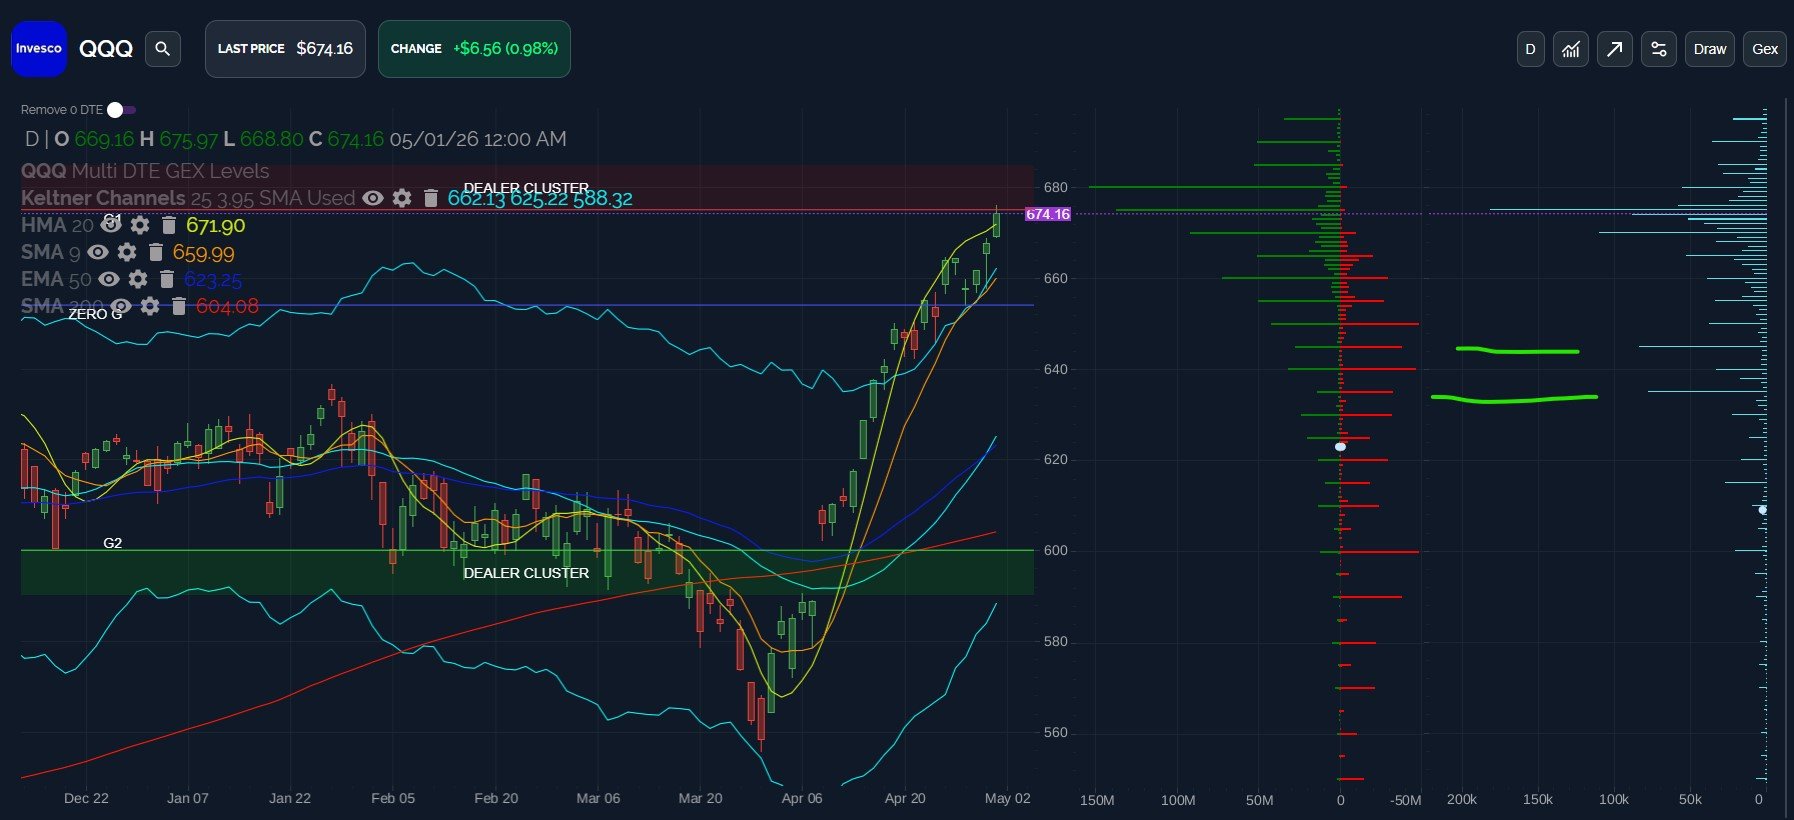
The daily chart looks bullish. We have a strong move higher, and the Keltner channels are pointing higher, typically associated with strong uptrends. This automatically impacts my personal bias toward a “buy the dip” mentality.
In the short run, things are getting a bit ridiculous. QQQ’s price is extended above the upper Keltner channel, and Friday just barely saw a push above the HMA. The fact that the HMA is above the upper Keltner is in itself a warning sign in the short run, based on my past observations.
We noted that GEX drops off significantly after 680, excluding GEX that expired Friday. We also saw most of the volume (outside of 0 DTE option trades that expired Friday) below 675, with 635 and 645 seeing outsized volume.
My current conclusion is that the odds of a continued move higher for QQQ holding above 680 are fairly low, though the ongoing momentum deserves some attention. A hypothetical pullback to 635-640 would see price move back within the Keltner channels, approximately to the middle channel, also an area of option activity and meaningful GEX, so I like the idea of a dip buy in the 635-640 zone.
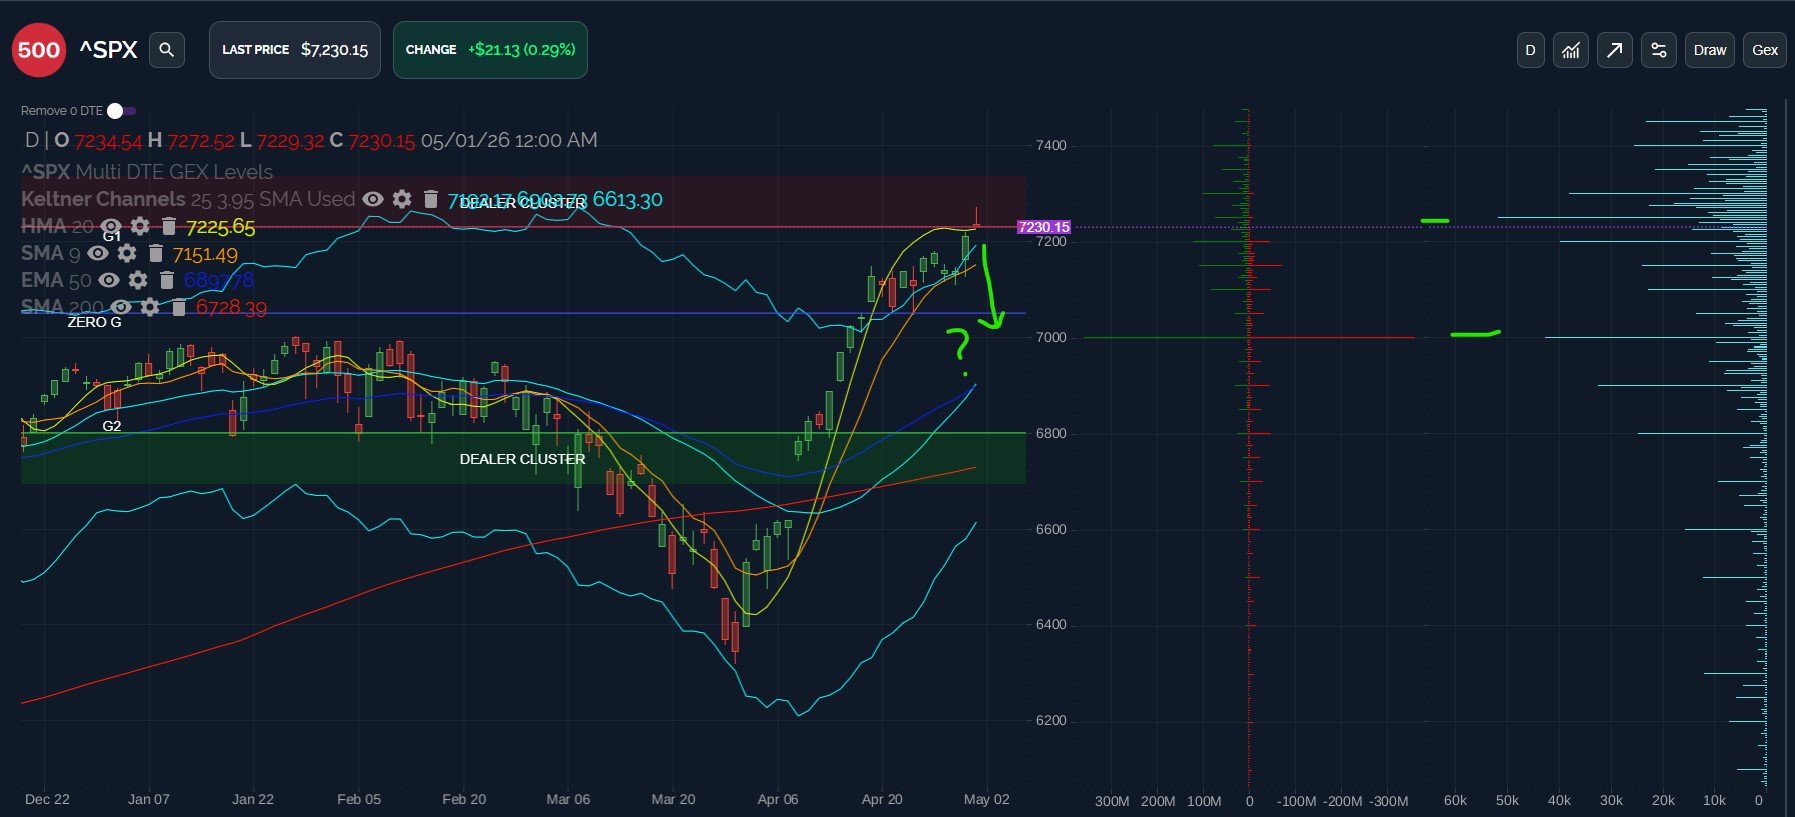
SPX’s chart looks slightly more bearish than QQQ Friday, painting a red candle with a long wick, though technically closing above the flattened HMA at 7225.65. Similar issues exist compared to QQQ: The HMA is above the upper Keltner, price is extended, and we see volume mostly below 7250.
7000 continues to be an initial target I’ll be watching when a pullback materializes, also representing the 2nd largest amount of option volume on Friday, excluding 0 DTE GEX and 0 DTE volume from Friday.
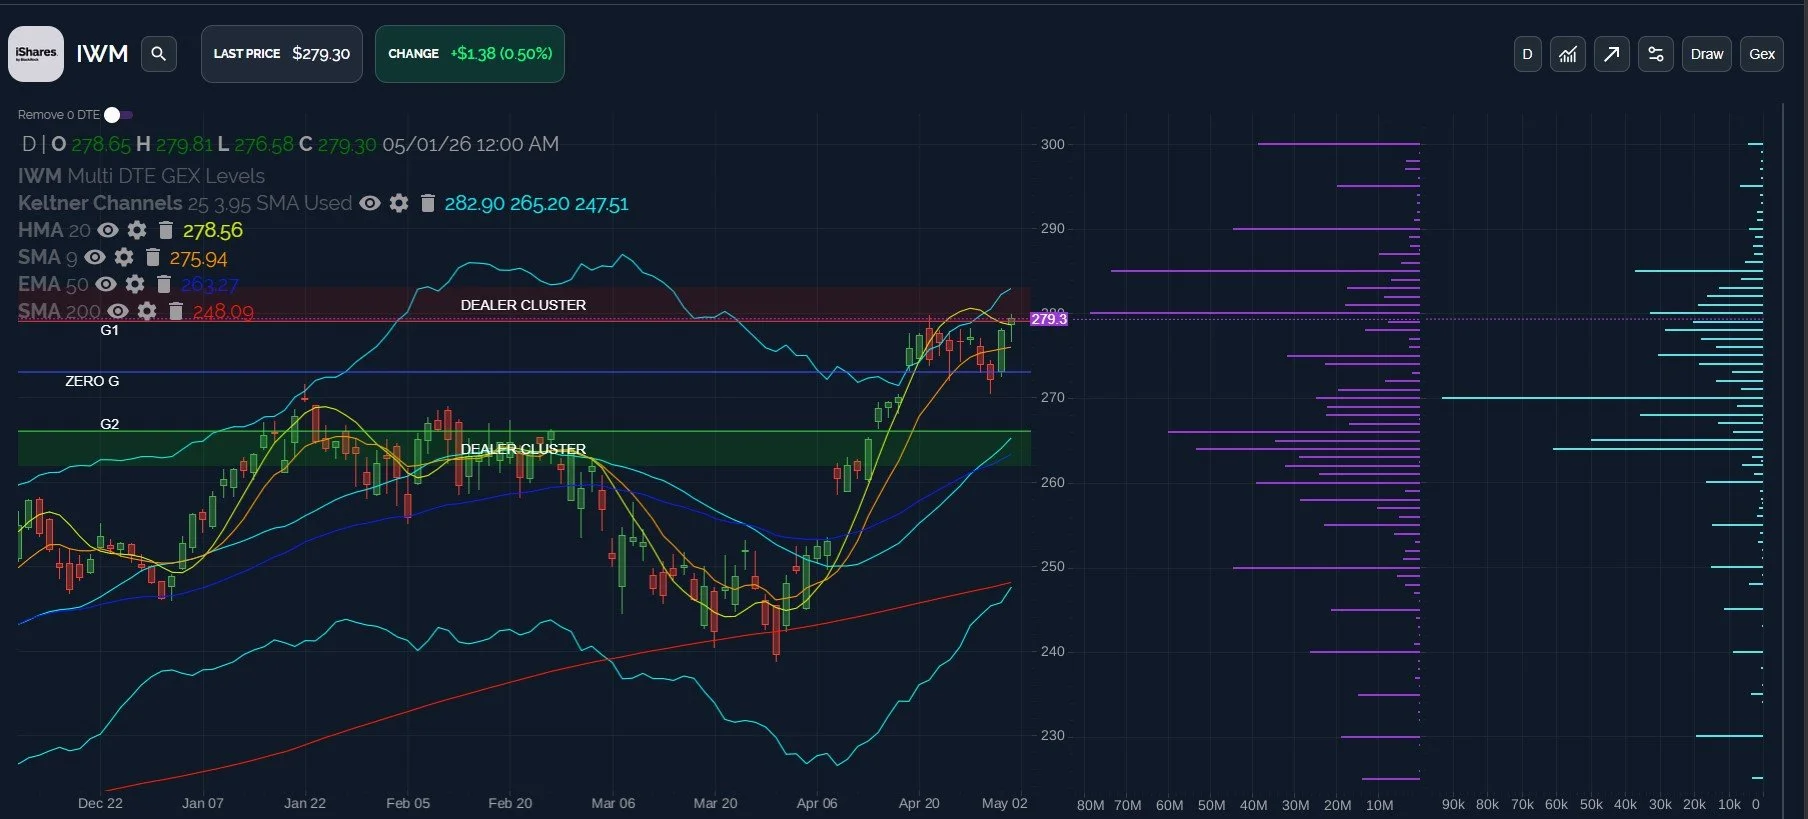
IWM looks more bullish than other indices from my view, at least in terms of having had at least a larger pullback compared to the others, and we see price still respecting the Keltner channels. IWM also closed above the HMA.
The offsetting negative factors for IWM include the repeat volume at lower strikes and GEX still remaining in a significant way at lower strikes.
In the short run, I think IWM will hold 285-290 if upside continues, with immediate risk of a pullback toward 260-265.
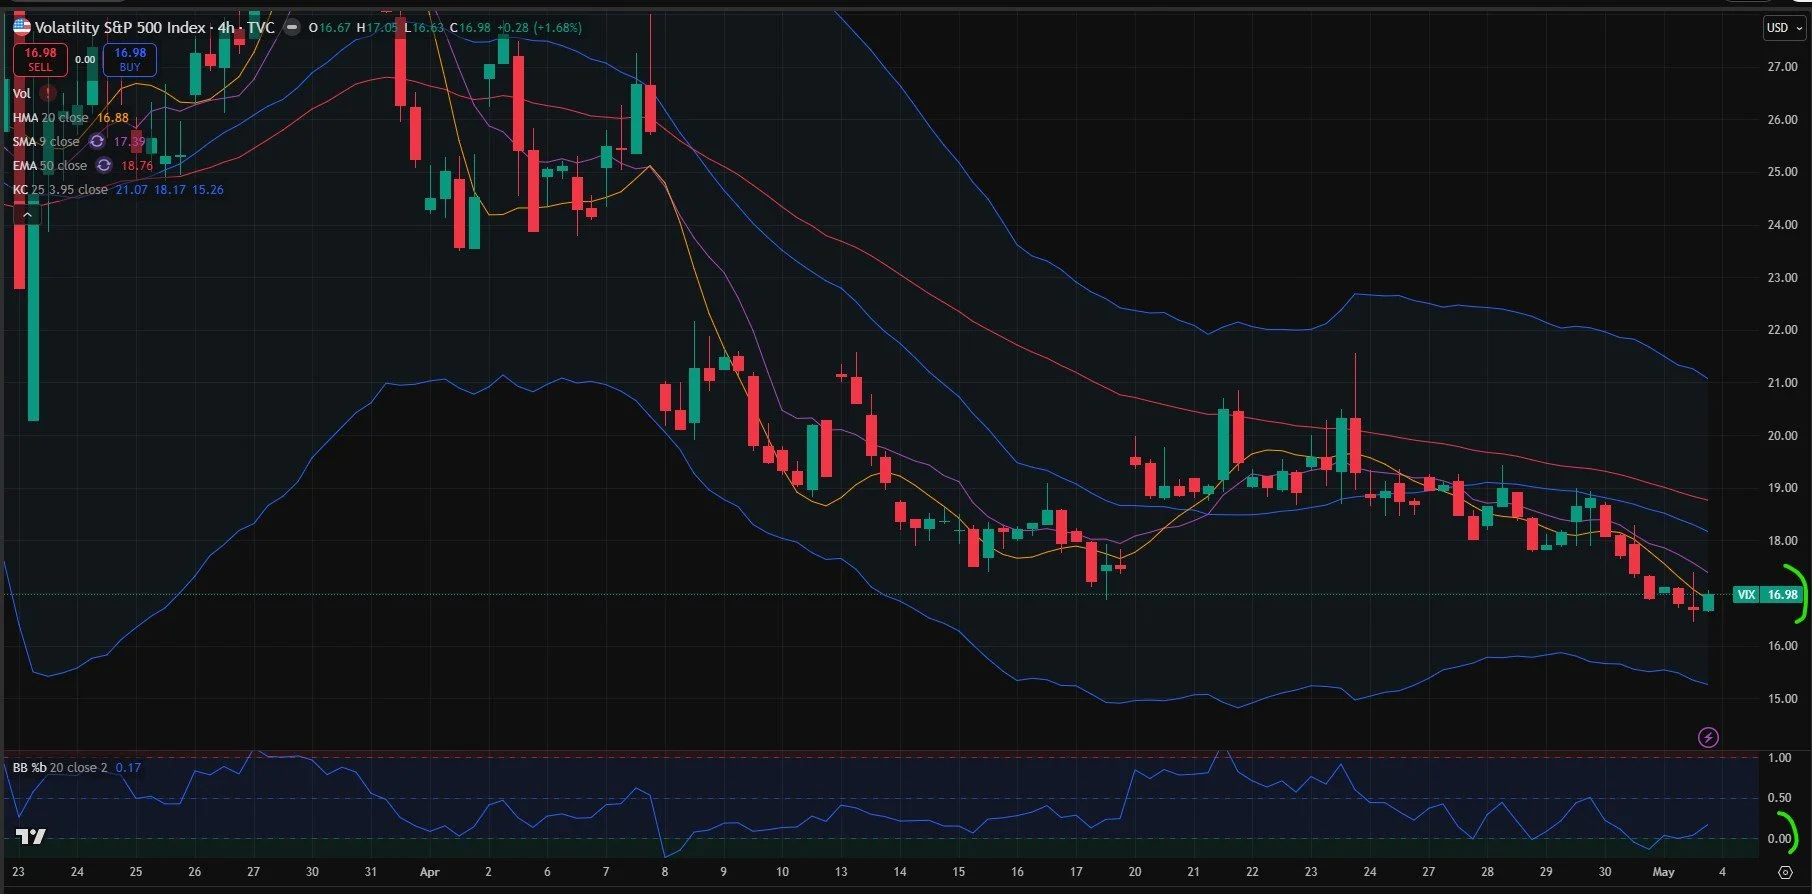
The VIX 2-hour and 4-hour charts are my favorite timeframes in terms of shorter-term indications for volatility, and we see the VIX closing above the 4-hour HMA for the first time in 8 bars. We also see the %B indicator back above 0.00 after diving below zero at the end of April.
The VIX itself doesn’t look very bullish for volatility, which fits well with our “buy the dip” scenario. A VIX spike to the 19-21 zone is likely a good contrarian dip buy, in our opinion.
We will watch intraday developments closely Monday, and we’ll share what we’re seeing in Discord.
We invite you to join us in our discussion in Discord Monday, and we appreciate your participation!
To enter Discord as a non-subscriber, go to our homepage and click on Community to enter our Discord server! First-time guests receive a free 7-day trial of the premium Discord channels and this is where we discuss what’s happening in real-time.
We conduct a livestream that is accessible from our homepage every day around 10:30am ET, so feel free to join us there. You can also listen to our most recent livestream any time before the next day’s livestream occurs.
Get $300 off of the annual Portfolio Manager subscription by entering TAXES2026 at checkout!
Thanks for being part of our community and know that we invite and appreciate your feedback!
The information provided by Geeks of Finance LLC is for educational purposes only and is not intended to be, nor should be construed as, an offer, recommendation or solicitation to buy or sell any security or instrument or to participate in any transaction or activity. Please view our Investment Adviser Disclaimer and Risk Disclosure.