
VIX Capitulation, SPX Tests Resistance: May 22 Stock Market Preview
Get $300 off of the annual Portfolio Manager subscription by entering the code MAYFOMO at checkout! This will only last for a limited time!
Tonight’s YouTube video takes a look at SPX, QQQ, BTC, DIA, IWM, WMT, and AAOI, so check it out if you have 7 minutes! The current and prior videos can be viewed by clicking Community at the top of our homepage to find our YouTube channel link.
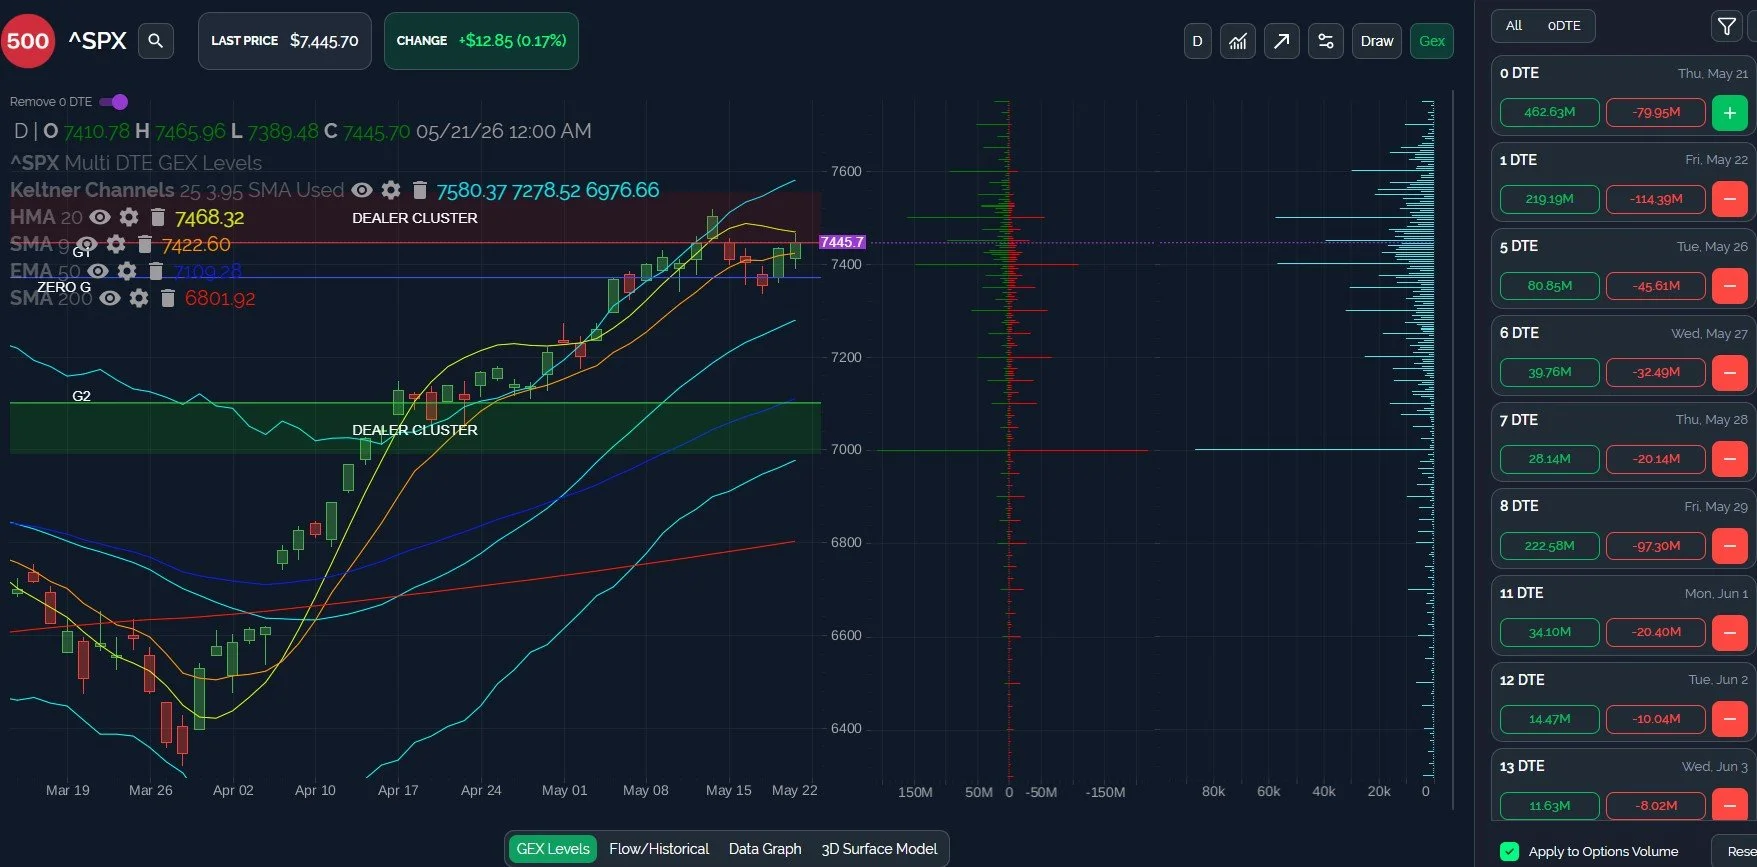
SPX: Approaching a Short-Term Top?
There’s no mistaking the rally since late March as anything but bullish. But even bullish moves have pullbacks. Well, at least in theory, right? At least we were gifted 3 red candles in a row recently, which was a first since the rebound began.
We’re now at a spot where we’re starting to see some conflicting signals: Price is rebounding, and the Keltner channels are still pointing higher. The upper channel is almost at 7600 on the daily chart. GEX is also present at higher strikes, and 7500 may be reached as soon as Friday.
Now for the conflicting part: Option volume (in light blue to the far right)- admittedly a more speculative element- continues to be more heavily weighted toward lower strikes, with 7500 as the exception. 7000 in particular has been the repeat favorite for options volume for many days, if we exclude 0 DTE volume. The HMA is also now tilted lower, and price is below the HMA.
Where does this leave us in navigating tomorrow? As far as SPX goes, the HMA at 7468 (essentially tested today with the high of day at 7465.96) and the large GEX cluster at 7500 are likely upside resistance areas. Any move toward 7500 may see consolidation and/or rejection, and that’s within the upper Dealer Cluster zone. Between 7422-7500 is a chop zone, and a more bearish bias emerges for us below 7422, with the daily close in focus as a determining factor. An intraday drop below 7422 will need to be evaluated in conjunction with what the 0 DTE GEX picture suggests for the best odds of success, in our view.
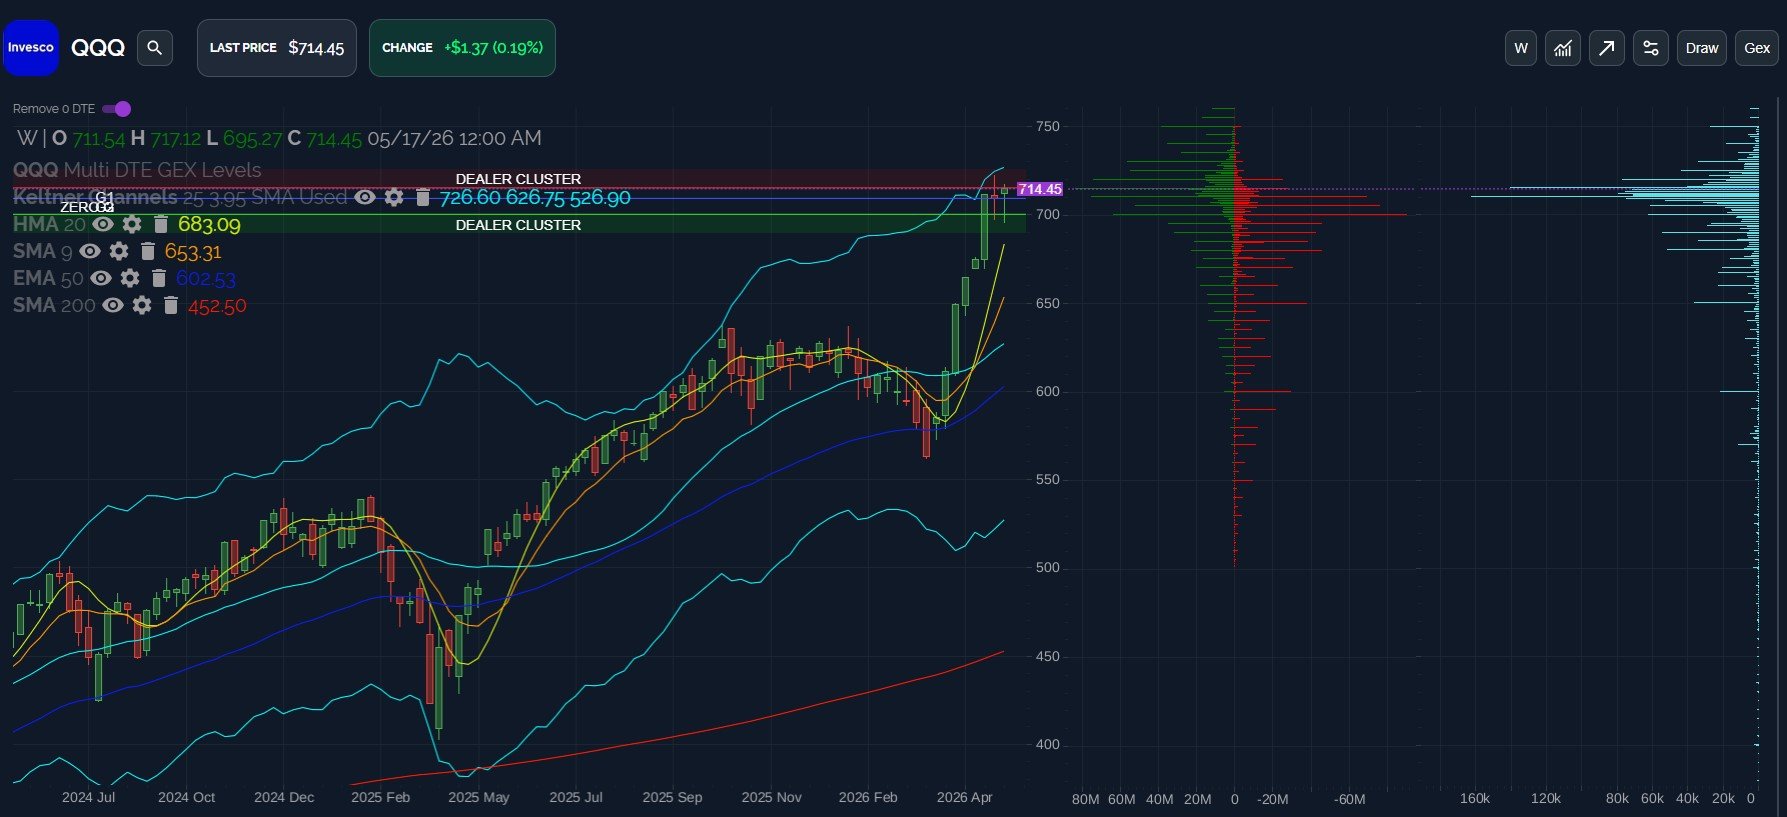
QQQ: Wearing Out Both Sides With Volatility Near The Top?
QQQ has been in “premium kill” mode since last week, with the indecision candle that formed after poking at the upper weekly Keltner channel. GEX is largely concentrated on the 700-720 strikes, and the semiconductor stocks have still been driving a lot of the movement.
I still believe the upper Keltner will serve as a fairly good guide for a general reversal area, especially in conjunction with GEX, and I have a potential reversal area of 718-727 that I’ll be watching on Friday, if the gain in futures carries through to the morning. Any downside action is likely to meet a wall of short-term support (in our opinion) between 680-700, to give a broad range.
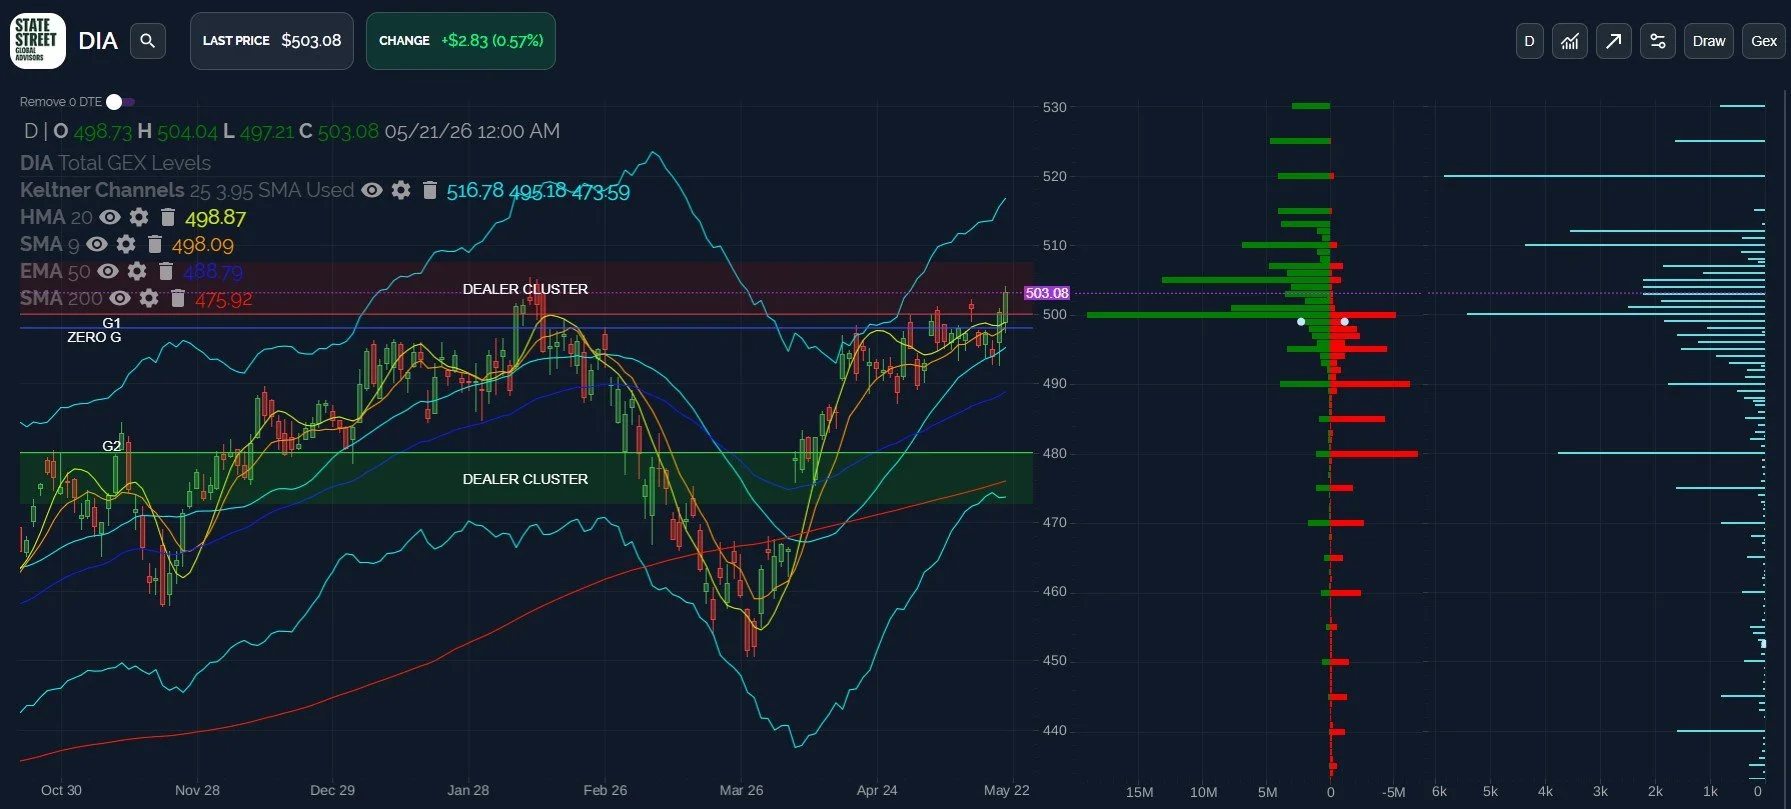
Dow Jones: Divergent, But Leaning Positive
DIA hasn’t exceeded the February 10 high yet, but today was close. If the market is indeed controlled by someone with a lot of money and an obsessive-compulsive disorder, which is entirely possible, perhaps DIA needs to make a new high before we can finally see the theoretical “downside” again. This new high could be incremental, and thus divergent in a negative sense, or it might be a deceptively convincing fast move toward 510-515 that fades as quickly as it happens. This is where we’ll consider the Friday GEX picture in deciding how to react to the opening area for DIA.
GEX shows 505 as an important level for Friday, and we see volume mostly skewed toward upside targets. The upper Keltner is almost at 517, not far from the 520 zone, where we see some GEX and a lot of volume today. An immediate loss of 499 may bring some lower targets into focus, with 480 appearing as an area of interest.
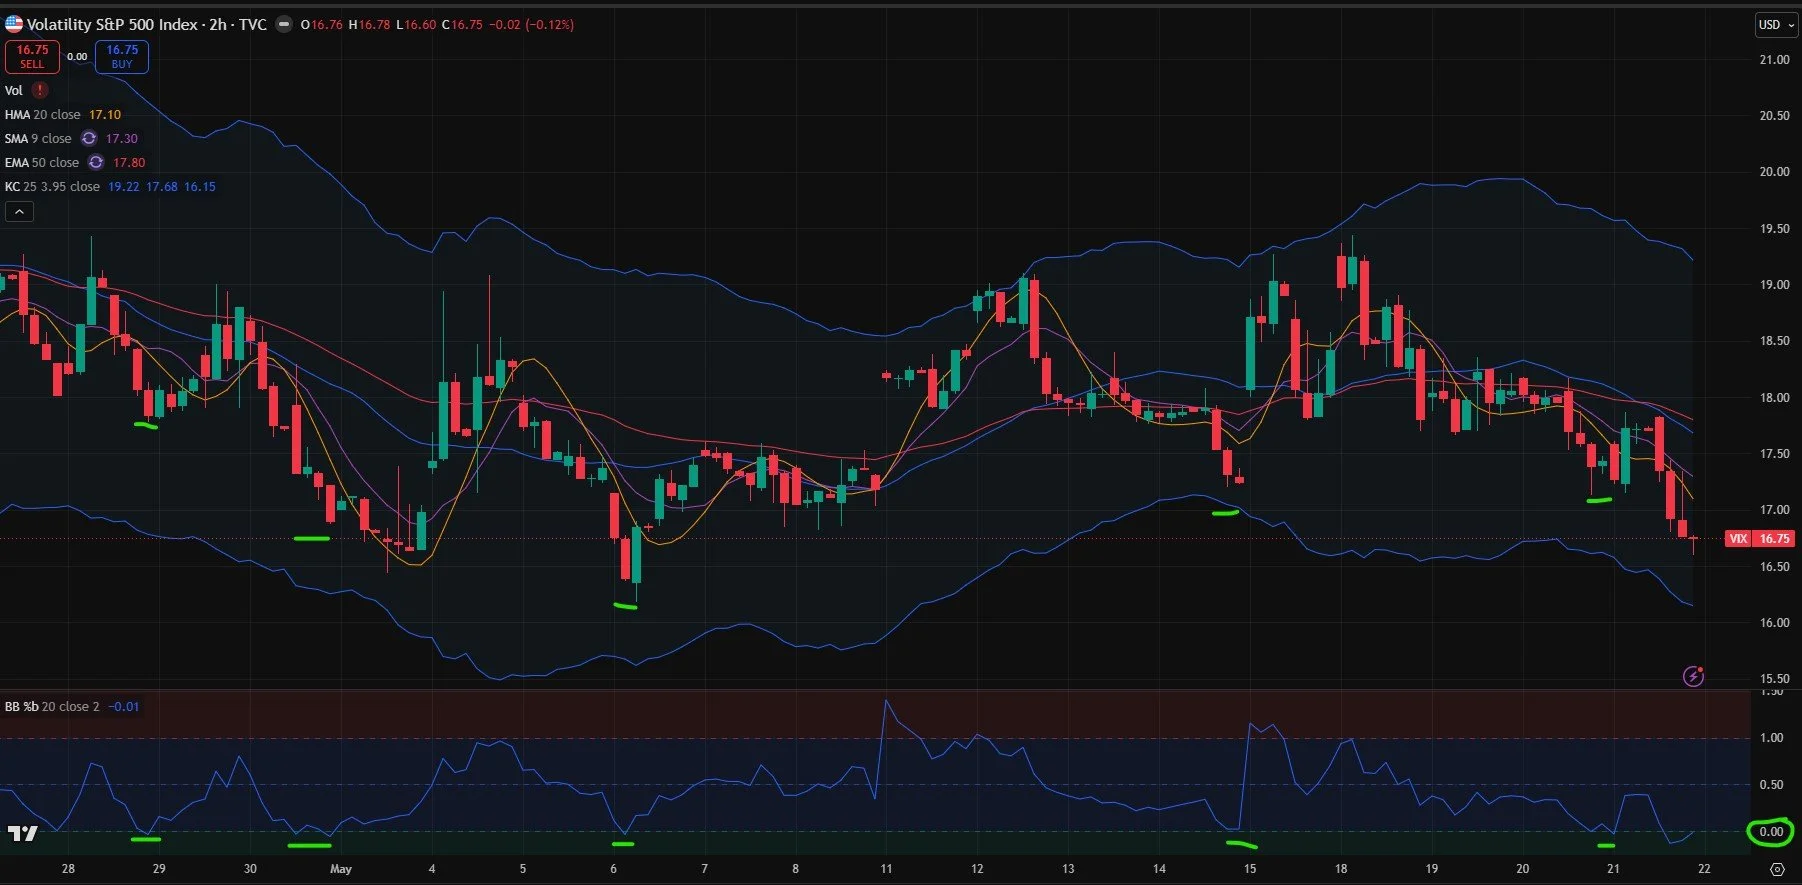
The VIX: Oversold With Risk/Reward Skewed To The Upside
The VIX 2-hour chart shows a neutral overall bias, but the VIX is approaching the lower Keltner channel, and the %B indicator is already below 0.00. I marked prior areas where we saw the VIX reach 0.00 so you can see what happened immediately after such readings, with 20% of those instances resulting in a very small immediate move higher, then more downside. 80% of the time, we saw a noticeable spike within 1-2 bars of the 0.00 reading. The conflict of the bullish and bearish indicators discussed earlier can only be answered by the price action we see in coming days, but the VIX tilts me more toward the bearish side in the short run, even if we see a move to SPX 7500. The VIX suggests the odds favor a reversal from this general zone, even if the VIX spike doesn’t make it beyond 20.
We will wait for the cash session tomorrow to see what the 0 DTE picture is telling us and we’ll be sure to share some of our observations for free in Discord!
To enter Discord as a non-subscriber, go to our homepage and click on Community to enter our Discord server! First-time guests receive a free 7-day trial of the premium Discord channels and this is where we discuss what’s happening in real-time.
We conduct a livestream that is accessible from our homepage every day around 10:30am ET, so feel free to join us there. You can also listen to our most recent livestream any time before the next day’s livestream occurs.
Don’t forget, our current promotion MAYFOMO can be entered at checkout for $300 off of the annual PM tier!
Thanks for being part of our community and know that we invite and appreciate your feedback!
The information provided by Geeks of Finance LLC is for educational purposes only and is not intended to be, nor should be construed as, an offer, recommendation or solicitation to buy or sell any security or instrument or to participate in any transaction or activity. Please view our Investment Adviser Disclaimer and Risk Disclosure.