
Q1 OpEx Friday: March 20 Stock Market Preview
Get $300 off of the annual Portfolio Manager subscription until tomorrow night, enter code SPRING2026 at checkout!
Tonight’s YouTube video focuses on SPX, IWM, the VIX, GLD, SLV, and NVDA, so check it out if you have a few minutes. You can view tonight’s and prior YouTube videos by clicking Community at the top of our homepage to find our YouTube channel link.
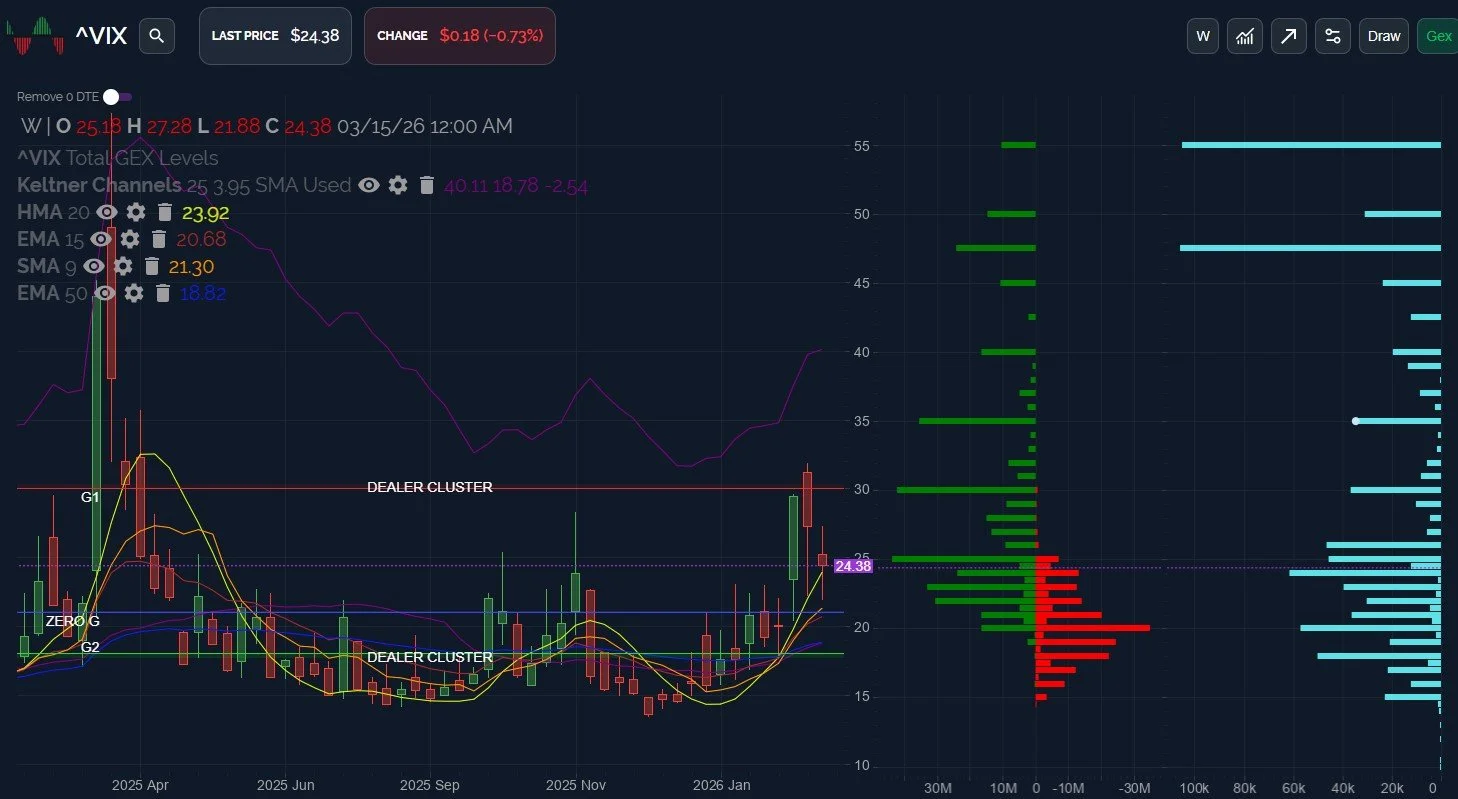
Despite SPX reaching a new 2026 low today, the VIX so far has been kept at bay, failing to make a new high this week. Does OpEx have anything to do with it, or is this some sort of meaningful bullish divergence? We can’t answer those questions, but the VIX is currently barely holding above a line that has held as support since the week ending January 4, which does seem to hold some significance.
Retests of the line have been holding so far, and the GEX picture combined with today’s volume still looks bullish for volatility. The picture of higher lows will be threatened if the VIX can close below the 21 area, but until then, we’ll be cautious of the underlying trend lower for indices.
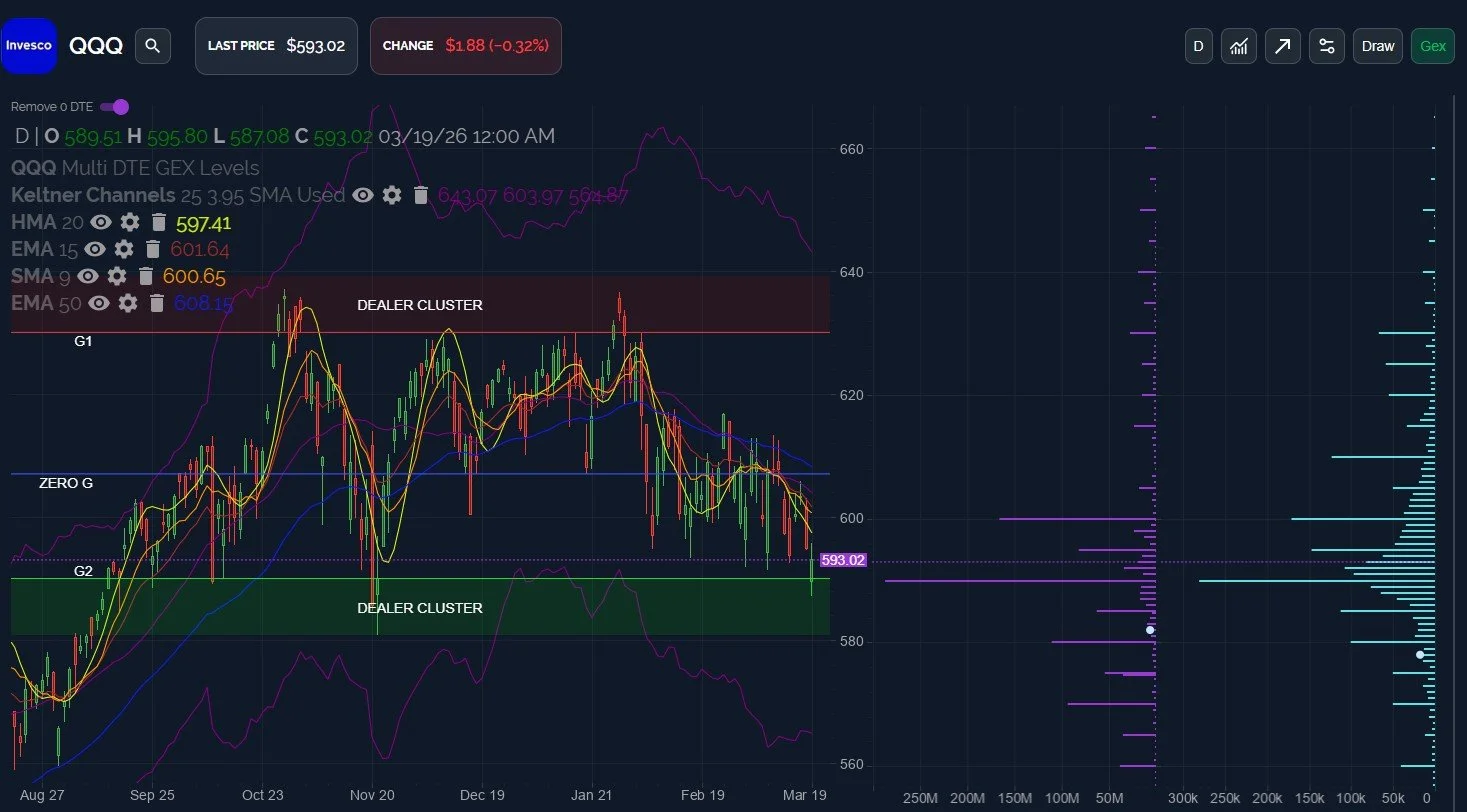
QQQ finally broke below 600, reaching as low as 587, right in between the 580-590 zone we just discussed yesterday.
Net GEX clusters are still mostly on the negative side, with 600 now an important potential resistance area, also matching with the 9 SMA.
Bulls may want to see the HMA at 597 and then the 9 SMA at 600 recaptured on a daily close to paint a more neutral picture for QQQ, otherwise, the weekly 50 EMA (not on the daily chart shown) is at 578 and we have the lower Keltner around 565, so both of those strikes may be worth watching in the event of continued selling.
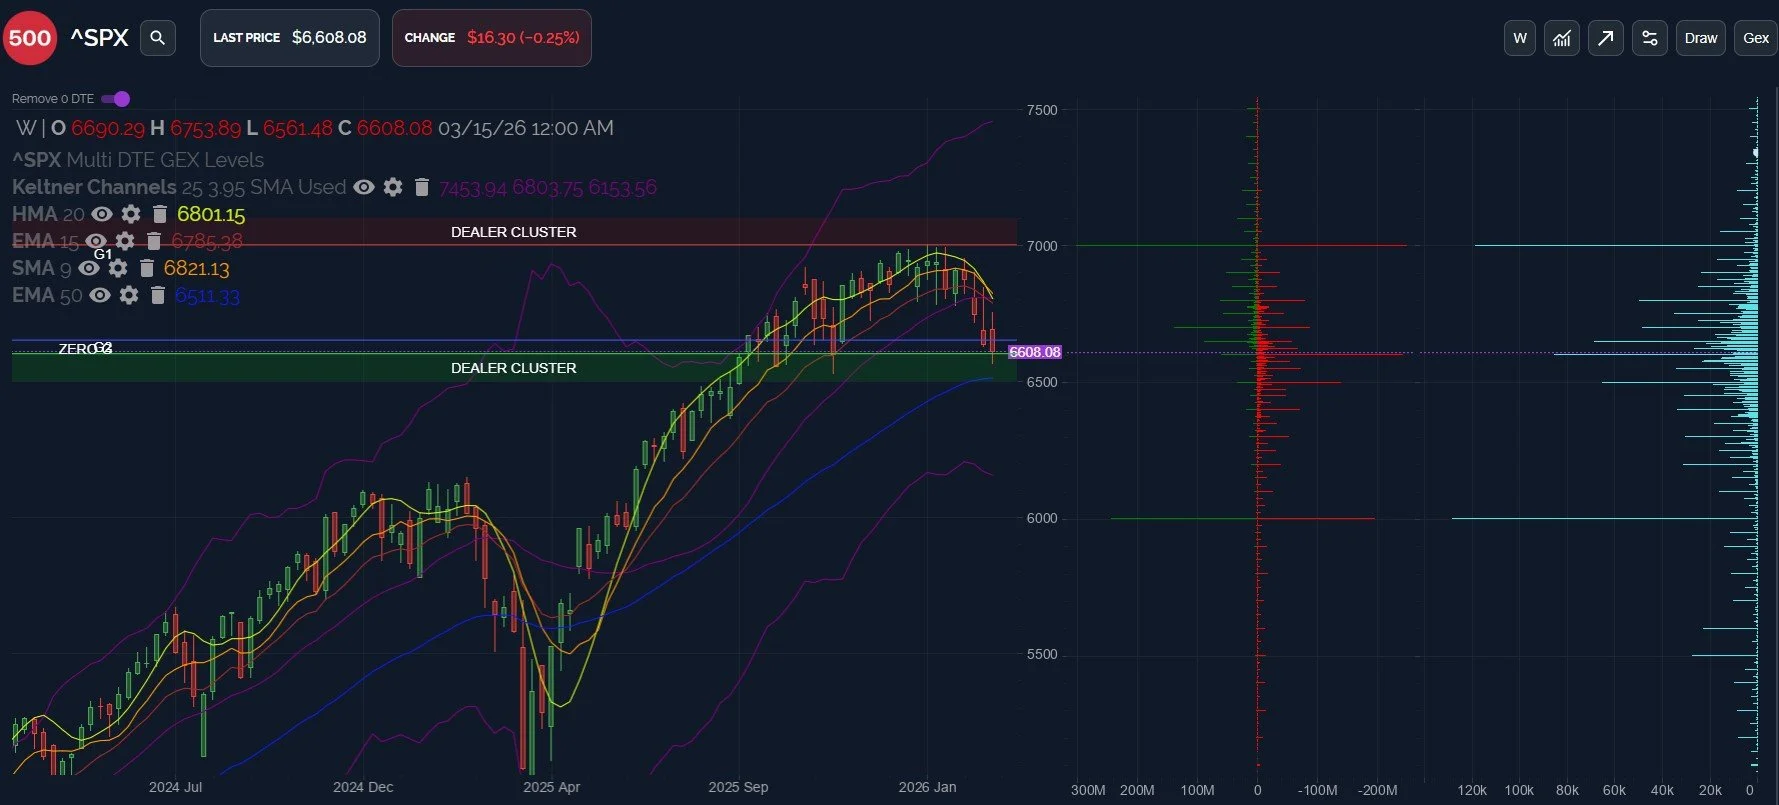
SPX bottomed today exactly 50 points away from the weekly 50 EMA, an interesting spot that hasn’t been touched since April 2025. Can we satisfy the biggest OCD traders on Wall Street with a proper tag of 6511?
I excluded 0 DTE volume and GEX from the chart, allowing us to view activity geared toward tomorrow and beyond as opposed to what already expired today. We see 7000 maintaining significance, both in terms of positive/negative GEX as well as the daily volume across all non-0 DTE expirations (in light blue). We also see 6000 with growing relative significance, and more volume traded than at any other strike.
I also notice the lower weekly Keltner at 6153 is at least within striking distance (no option pun intended), so could that be a destination down the road this year? We might entertain that idea if we can’t hold the 50 EMA at 6511, so time will tell if we need to revisit this idea or not.
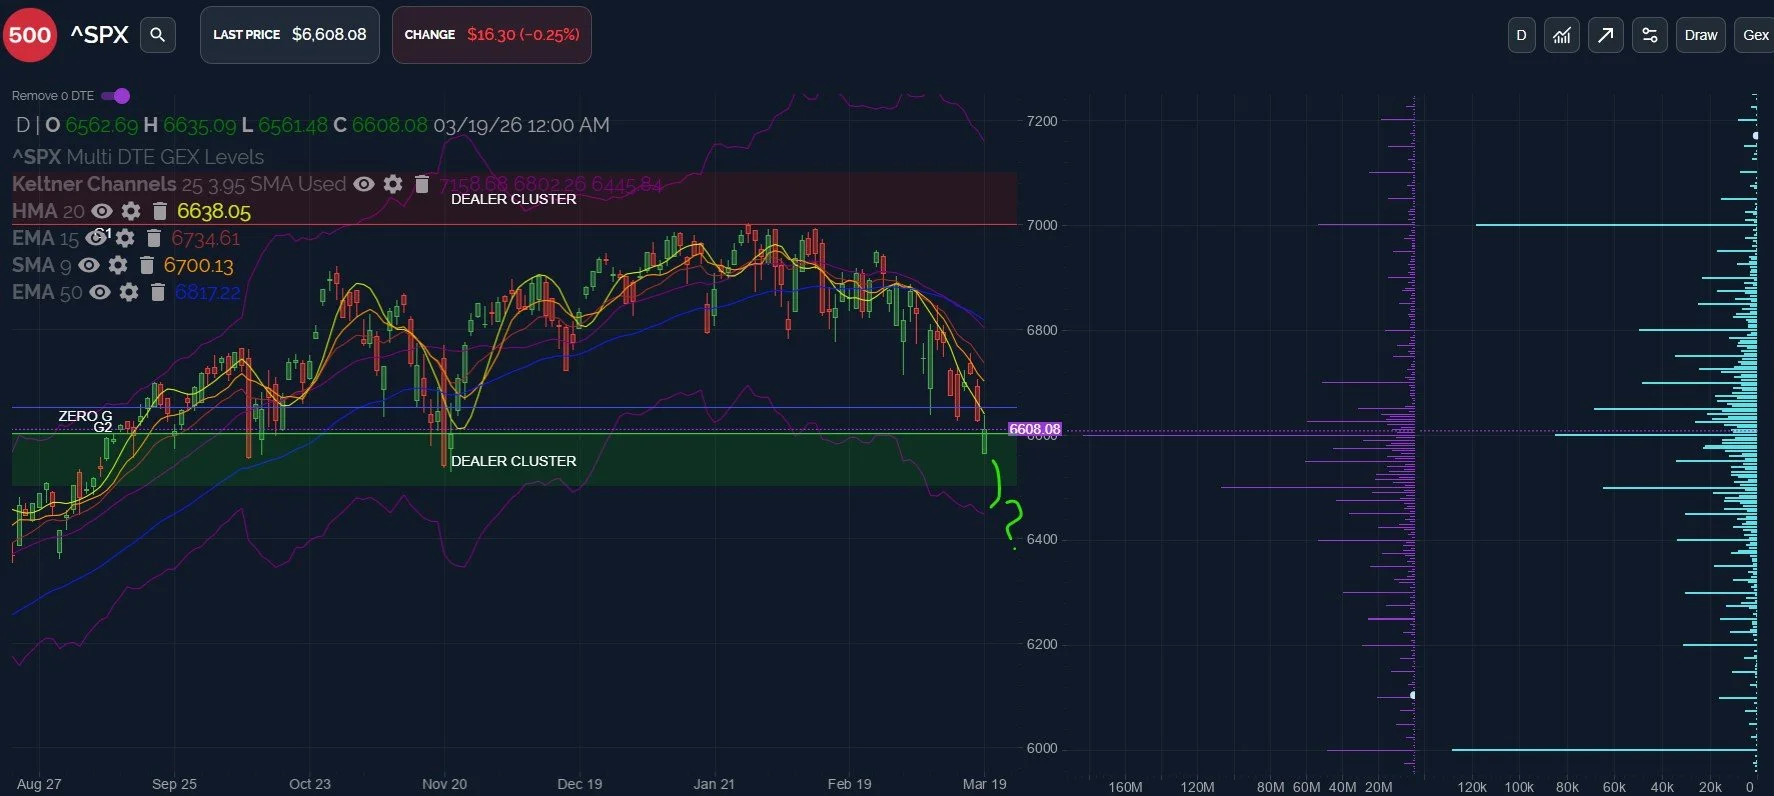
Let’s look at SPX from a slightly different perspective: Daily chart+net GEX instead of gross GEX.
The lower Keltner channel is currently at 6445.84 and dropping, and while the upper band is also pointing lower, my interpretation (not the only interpretation) is that the wide distance between the top and bottom channel gives a wide potential channel within which SPX may trade.
Initial headwinds for any rebound in SPX include the downtrending moving averages immediately overhead, with the HMA almost being tested intraday at 6638, rejecting so far.
6500 is the 2nd largest net GEX cluster and very close to the weekly 50 EMA we discussed above, making it a valid possible target in the near term, in my view.
Volume was highest today at the 7000 strike and the 6000 strike, are those JPM boys & gals at it again? I haven’t made any trading decisions because of a backstory behind why GEX exists at a certain level. I’d rather just say “Jesse Livermore is at it again!” If the level is important, I believe it will show up in the data.
SPX net GEX requires a magnifying glass to spot any improvement today, which is unfortunate for bulls who may have desired a more impressive improvement in the net GEX picture. We even see QQQ showing more negative net GEX compared to yesterday.
Unless GEX reaches an extreme relative to the GEX readings over the past year, negative GEX might just be…Negative. No contrarian value in the middle of a solid negative GEX reading, in my opinion.
OpEx tomorrow is the last of the quarter, and with the positioning changes that come with expirations, we may see a few surprises tomorrow. We’ll rely upon what we’re seeing with the 0 DTE GEX picture as well as the charts for various indices and the VIX, and we’ll share some observations in the Discord general chat as well. We hope you’ll join us!
To enter Discord as a non-subscriber, go to our homepage and click on Community to enter our Discord server! First-time guests receive a free 7-day trial of the premium Discord channels and this is where we discuss what’s happening in real-time.
We conduct a livestream that is accessible from our homepage every day around 10:30am ET, so feel free to join us there. You can also listen to our most recent livestream any time before the next day’s livestream occurs.
We’re still running an annual discount for the annual Portfolio Manager subscription through tomorrow, so enter SPRING2026 at checkout!
Thanks for being part of our community and know that we invite and appreciate your feedback!
The information provided by Geeks of Finance LLC is for educational purposes only and is not intended to be, nor should be construed as, an offer, recommendation or solicitation to buy or sell any security or instrument or to participate in any transaction or activity. Please view our Investment Adviser Disclaimer and Risk Disclosure.