
This Dip Will Never Stop Dipping
THE SPRING PROMO IS HERE- We’re offering $300 off of the annual Portfolio Manager earlier than usual in March as we wrap up the 1st quarter of 2025 and celebrate the release of major updates last week! We now have overlayed chart indicators and several backtested algos complete with notifications and we anticipate more near-term improvements. Your needs are our focus, and we want the platform to become indispensable for your trading! Enter code SPRING2025 at checkout to take advantage of this limited time offering.
I knew the next breakdown would require saying what is never to be said- that “this time is different!” So now I’m hoping to provoke a surprising rally by jinxing the durability of this long-lasting decline. Those who act upon my headlines instead of the comprehensive contents of the newsletter shall be punished by their actions accordingly. Alright, kidding aside, today wasn’t different, it was very similar to last week: Friday rally, Monday complete destruction. Tonight’s YouTube video (which can be viewed by clicking here) covers our view of SPY in depth, as well as a look at weekly charts for IWM and analysis of the VIX. We complement these discussions in the newsletter, so let’s get started.
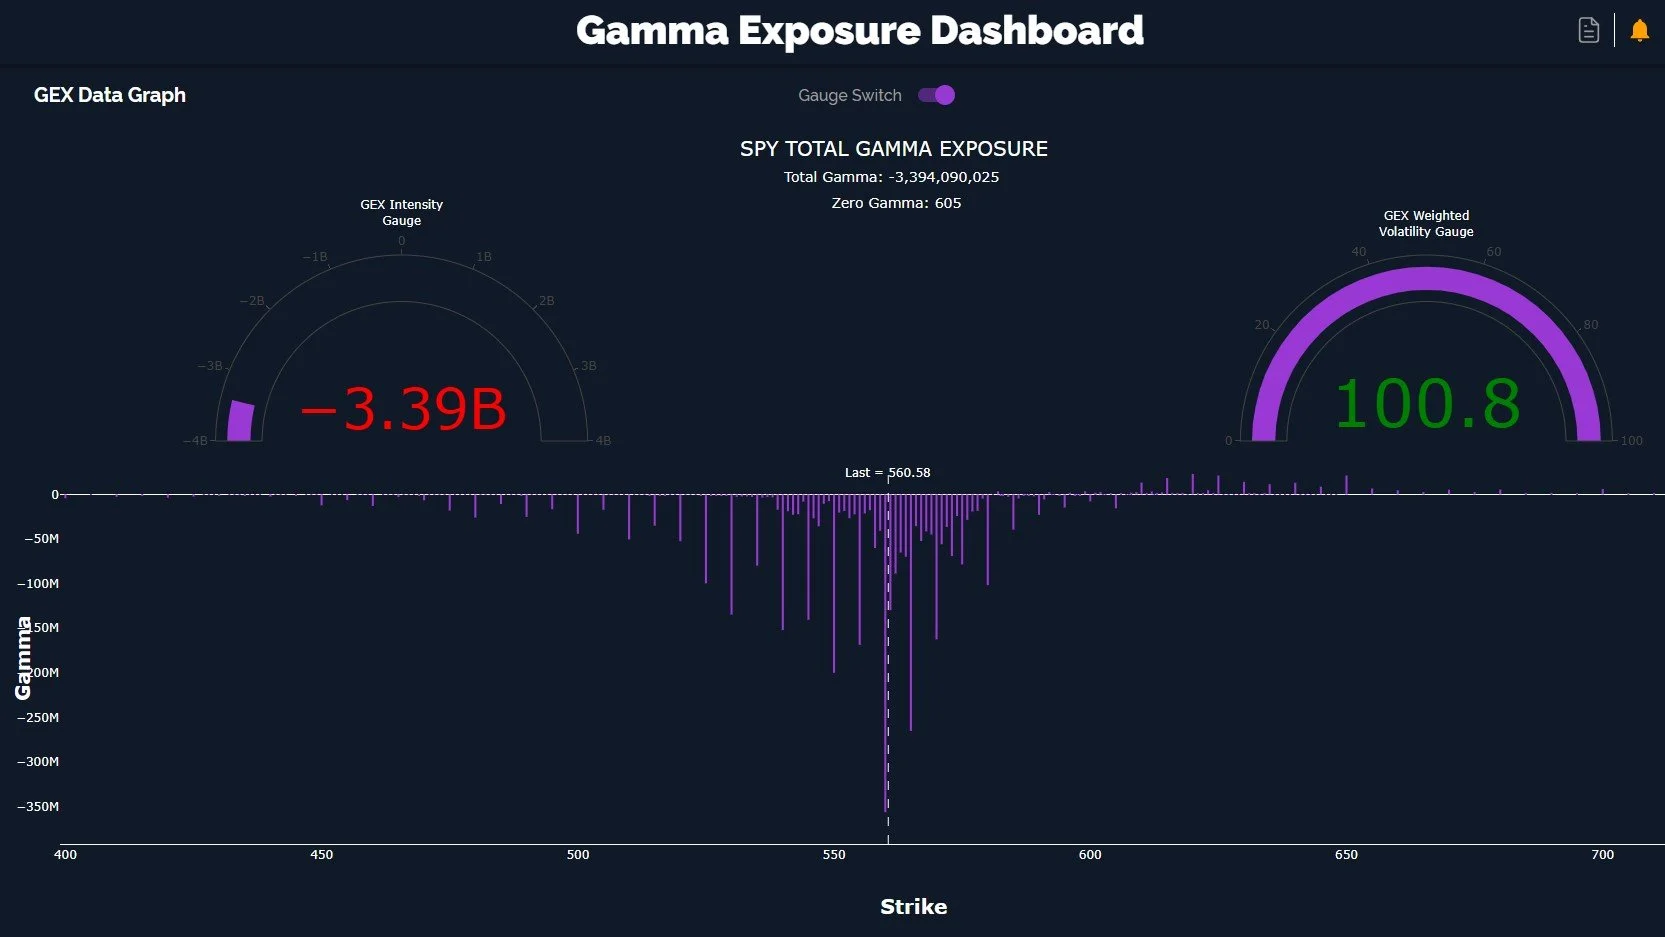
Our morning update in our Discord Gamma Exposure Updates channel noted “The current picture points to the possibility of 5600, with 5500 as a bit ‘scarier’ destination.” Little did we realize we would reach the middle of that range before the day was over. The negativity today left SPY with a deeply negative total GEX picture, not far from a -4B extreme reading. With GEX remaining negative going on 3 weeks, we don’t yet see the flip to positive GEX we’d like to see, but we are also keenly watching the risk/reward of a possibly dramatic extreme negative GEX bounce to the upside. The larger view picture remains uncertain with the current decline fitting typical correction standards.
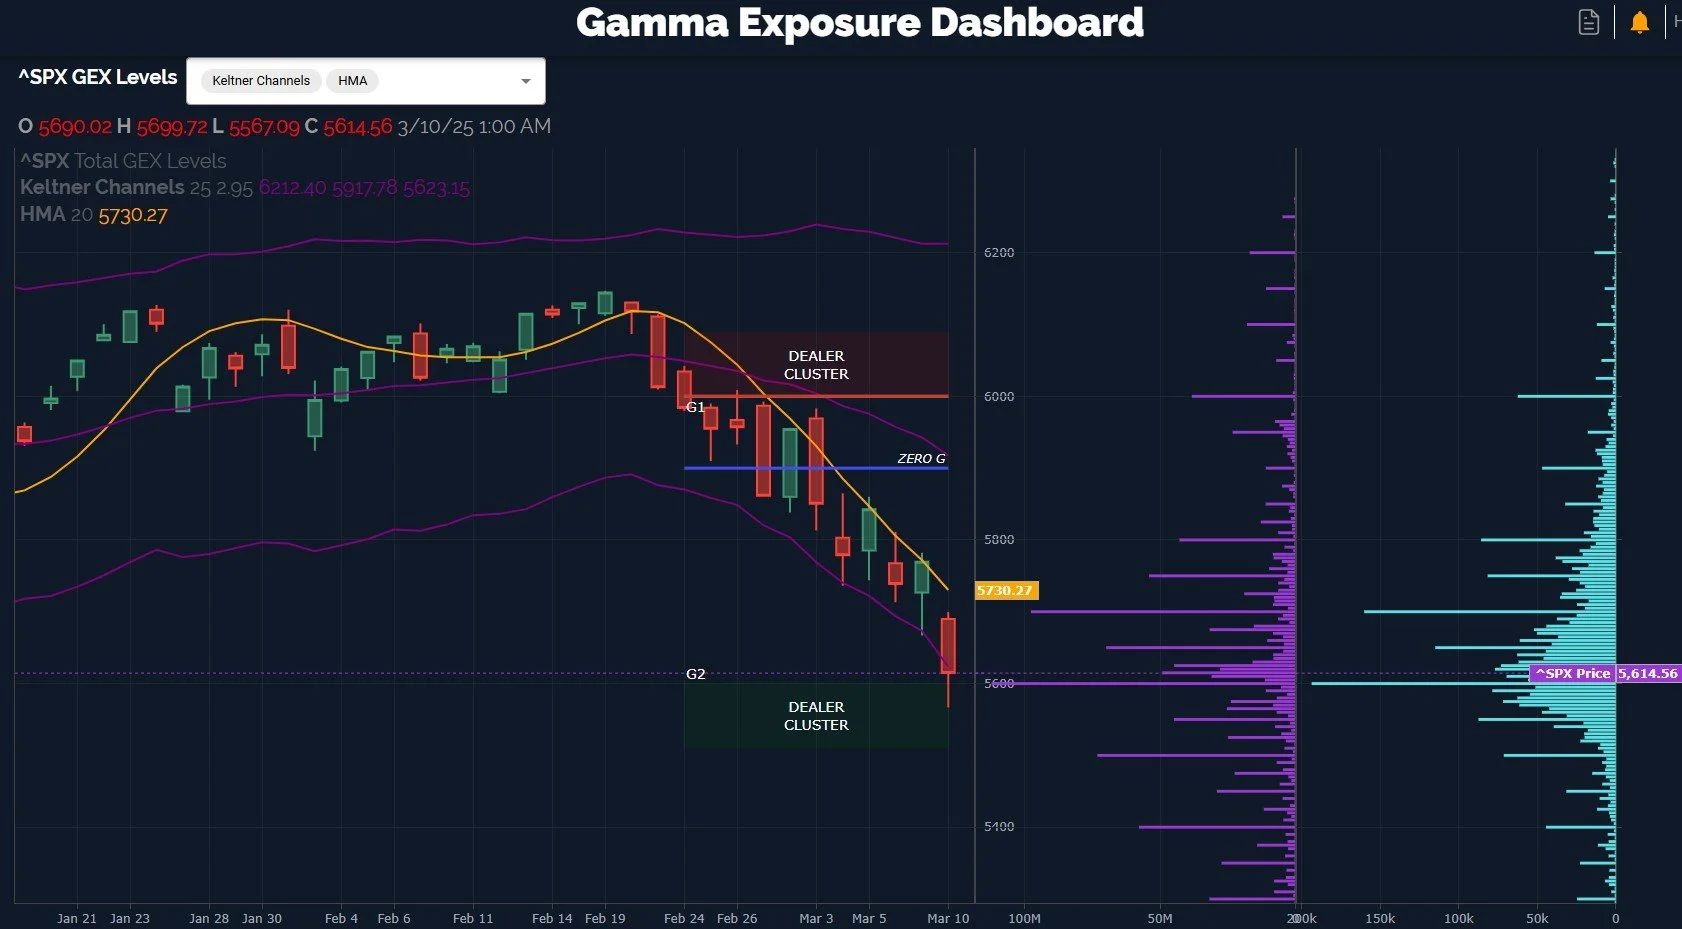
SPX has followed the guideposts of the Keltners and the Hull quite well, bouncing between the lower Keltner and the Hull in what seems to be very controlled fashion. I got ahead of myself twice in the last week with the technically positive closes above the Hull that ended up being tops instead of launching points to go higher, and at this point, reaching the Hull as a resistance point alone will be a nice move higher, due to the current oversold conditions. A meaningful and decisive close above the Hull continues to be an important line-in-the-sand for me as we see how this decline continues to unfold.
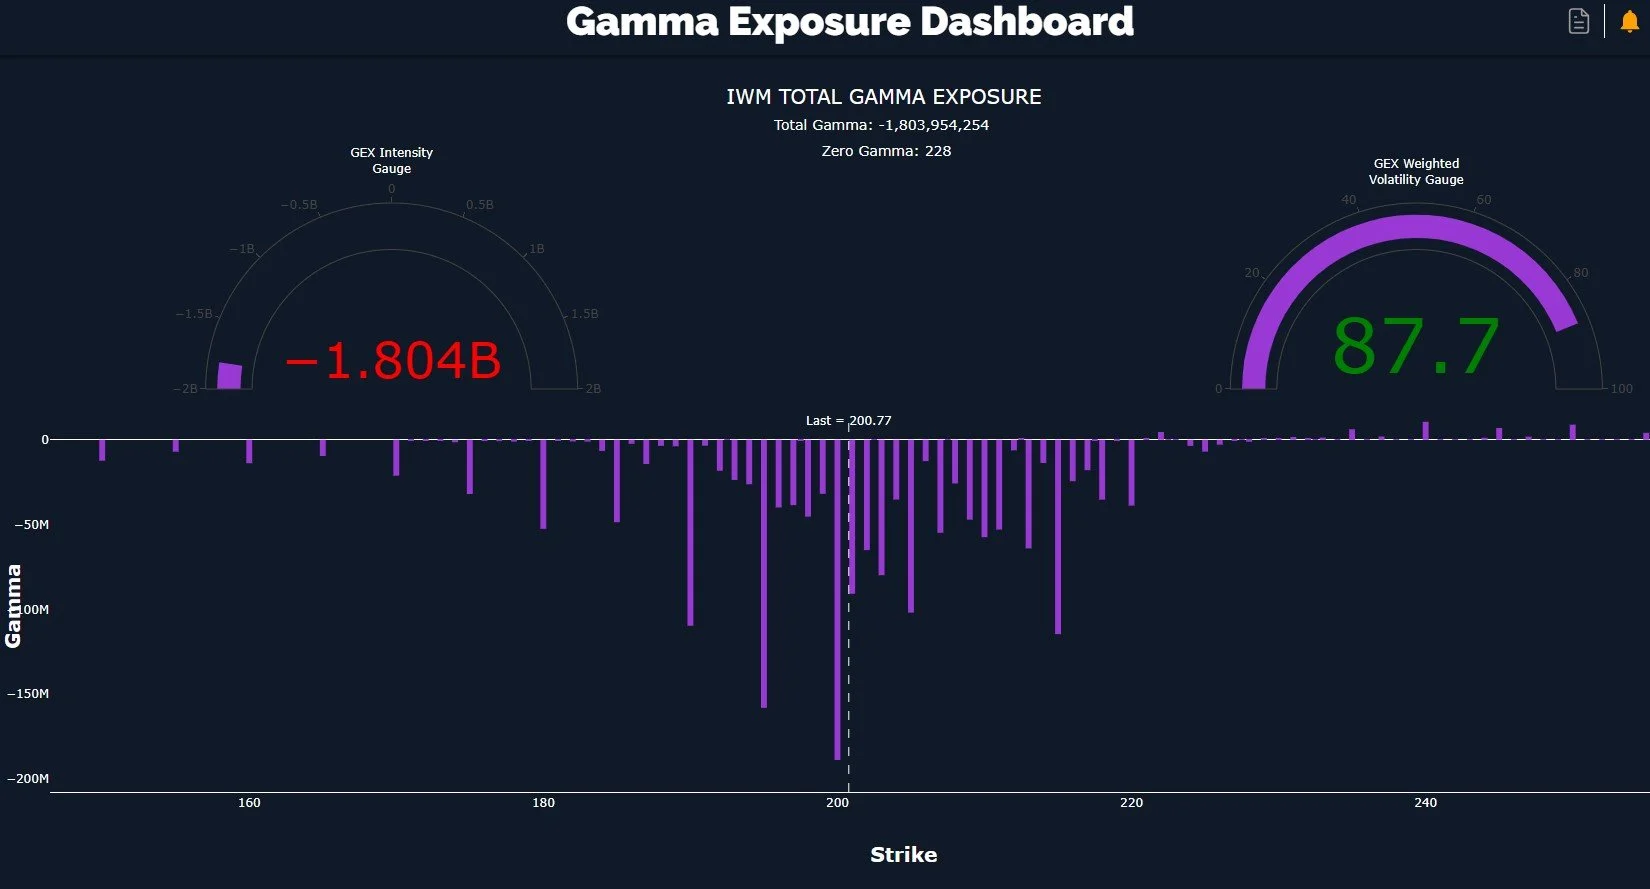
IWM is also extremely one-sided with a focus on the negative GEX side of the aisle, and near an extreme reading, currently at -1.8B. If we zoom out to the weekly, which we cover in YouTube tonight, we see 190 as a possible downside target if we continue lower. The lower Keltner is currently at 192 on the weekly.
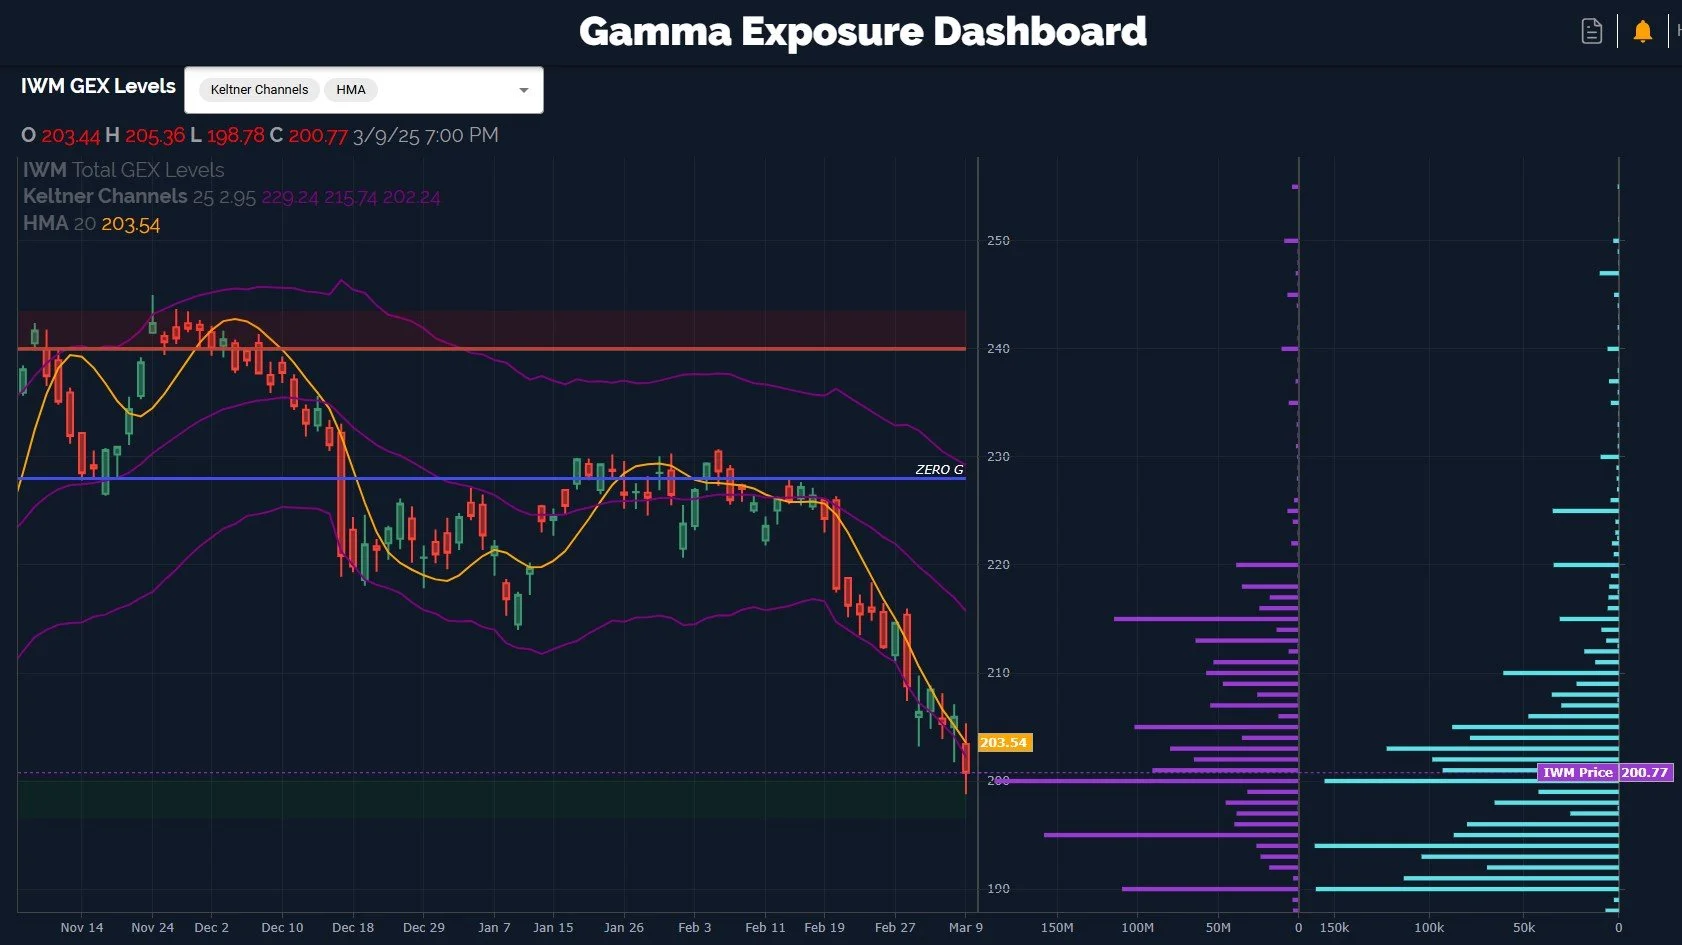
Looking at IWM’s daily chart, we are in the lower Dealer Cluster zone, though volume remains high at 190, 195, and of course at 200 where we closed. I still like IWM as a possible early rebound vehicle given the well-advanced decline in the Hull, not far from IWM’s current price. 215 is not just the middle Keltner and the Hull moving average (on the weekly chart) but it’s also a sizable GEX cluster, so we have a confluence of different timeframes showing 215 to be important. I see this area as an important resistance zone based on the current picture.
The VIX seems to be climbing a staircase toward an elevator that goes up, at least that’s how previous VIX uptrends have ended. Sometimes the spikes can be fast, and we have meaningful GEX at 30 and 35 that will have to be contended with for the VIX to move any higher, but that can happen quickly in a VIX spike as participants quickly reposition. We’ll see how it unfolds. On the bullish side (bullish for stock indices), most volume on the VIX was at lower strikes, so just maybe the 30 area will hold for now.

We have plenty of excuses for either a crash or a sharp rebound this week, with CPI on Wednesday and PPI on Thursday, as well as several big bond auctions that will be interesting to watch. The jobs report and consumer sentiment may hold surprises as well. We don’t try to guess economic data points, just realize the context of risk/reward in the market at the current moment based on quantitative data and understand that these catalysts can serve to mark important pivots for the market. With OpEx next week, it wouldn’t be surprising to see an opposite move start either this week or next, so we’ll take it day by day.
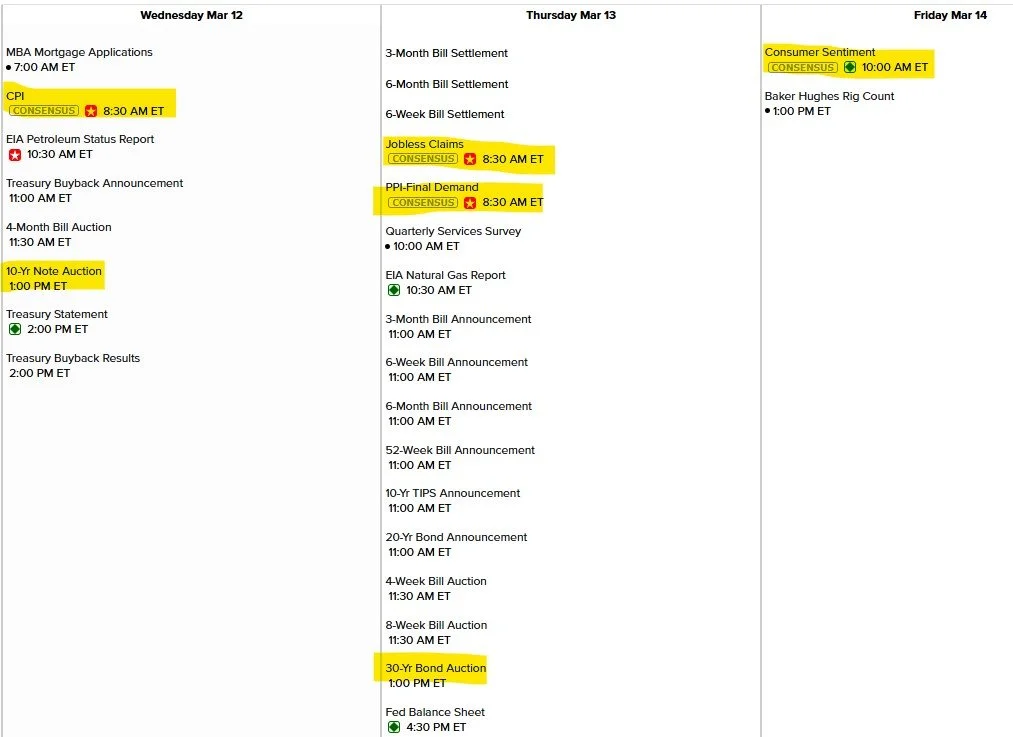
www.econoday.com
Here’s the Discord link if you haven’t joined us yet! Access is free for some channels, and new members have a 7-day trial within Discord to see how we operate. We have an active community of thoughtful traders who chime in throughout the day, sharing ideas and opportunities as we see them.
If you’re interested in accessing our tools and analytics, be sure to check out our website! We rolled out backtested algos and chart indicators and we have more improvements on the way!
If you’re interested in learning more about our strategy and approach, we address all of these topics in our Geek University course which is included in all memberships.
We recently posted a YouTube video, and we have many other short videos, so give our channel a look if you’re curious about recent market commentary and ideas as well as gamma (GEX) concepts explained.
Thanks for being part of our community and know that we invite your feedback!
The information provided by Geeks of Finance LLC is for educational purposes only and is not intended to be, nor should be construed as, an offer, recommendation or solicitation to buy or sell any security or instrument or to participate in any transaction or activity. Please view our Investment Adviser Disclaimer and Risk Disclosure.