
SPX Approaching A Bounce? February 6 Stock Market Preview
Our $300 discount off of the annual Portfolio Manager subscription won’t last long, enter code WINTER2026 at checkout!
Our YouTube video today covers SPX, QQQ, the VIX, AMZN, SLV, and GLD, so check it out by clicking Community at the top of our homepage to get the link to our YouTube channel!
Today’s gap down and go down action was a different twist on the last two days of decline, also failing to bounce significantly into the close.
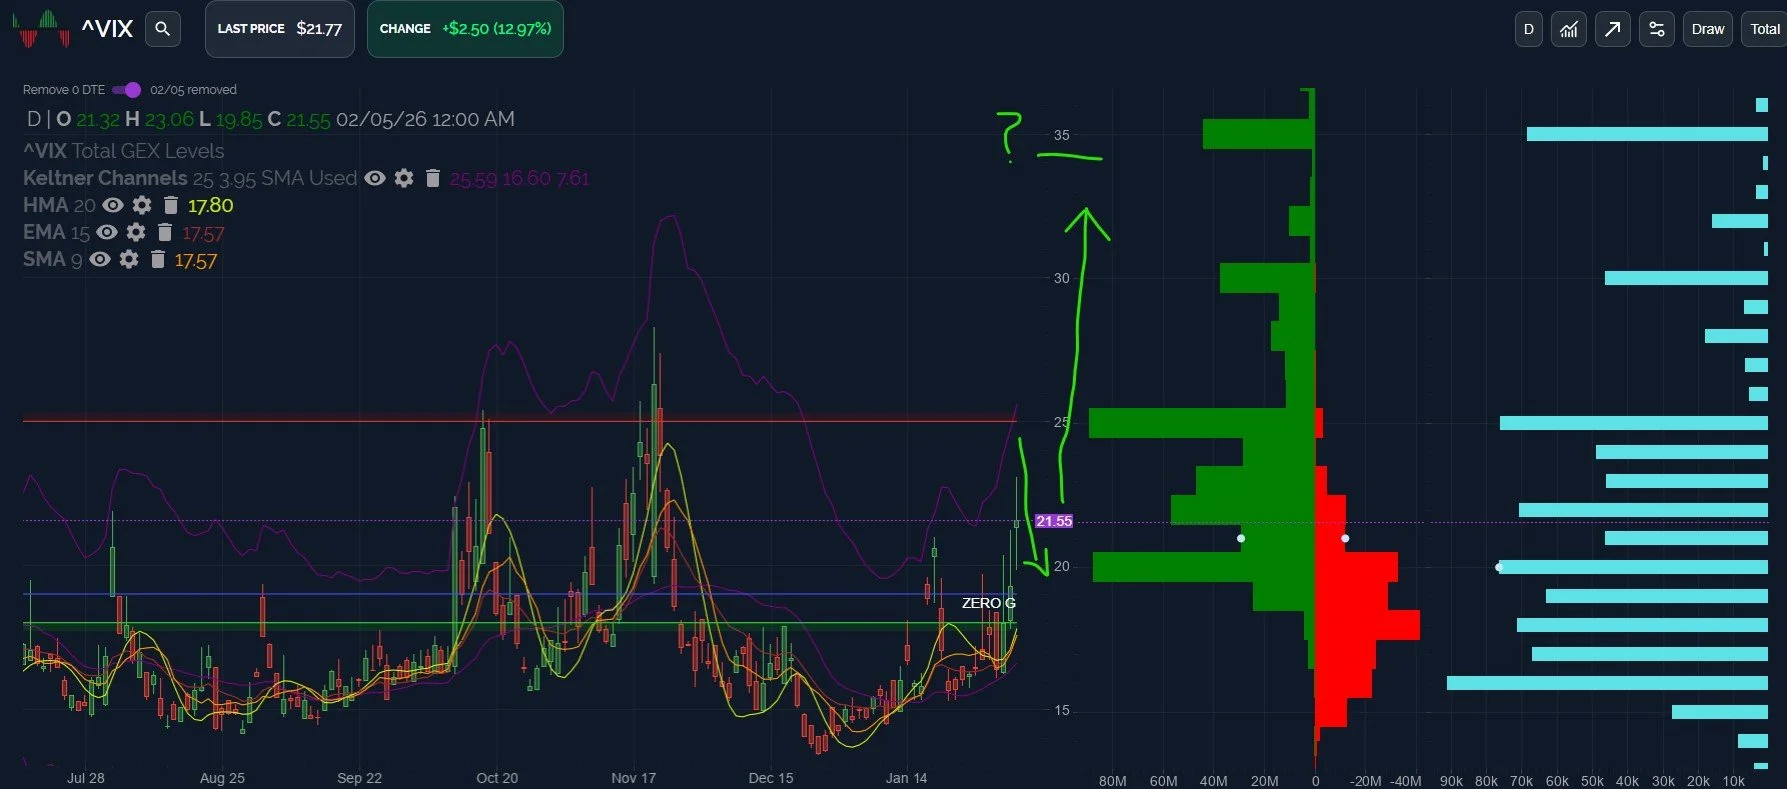
The VIX pattern we’ve warned about for a couple of weeks is playing out as the VIX attacks levels that might reach 25 imminently. GEX is positive and we see GEX growing up to 35, which could end up being a target presumably after some sort of bounce for stocks.
We may reach 25 immediately, and today’s high was just over 23, but whether we do or don’t, a pullback for the VIX and a rebound for the market appear imminent. In the event of such a pullback for the VIX, we want to see what happens around the daily 9 SMA and Hull (HMA), currently near 18.
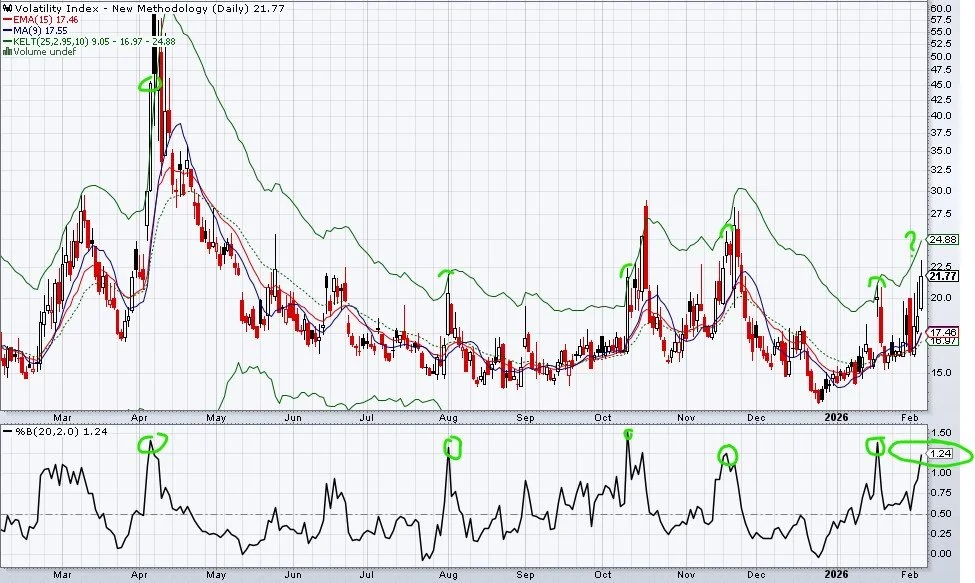
One of my favorite reversal indicators that I haven’t referenced much lately is the %B (20,2), which does a good job of highlighting potential reversal areas with readings either at or below 0.0 or above 1.0.
The current situation with the VIX causing the %B reading to be 1.24 is ripe for a reversal. You can see just a few times reached 1.24 or higher over the past year, and virtually all of them saw at least one day of VIX retracement following such a reading, even if the VIX hadn’t yet reached its high.
The current VIX spike may see 25, causing the %B reading to rise further, but we’re getting close to previous tops for the indicator.
Even if we see a market rebound and a VIX crush, we can’t assume that the market pullback is over, we will need to reassess indicator conditions, charts, and GEX to try and improve our odds of properly positioning and trading the next move.
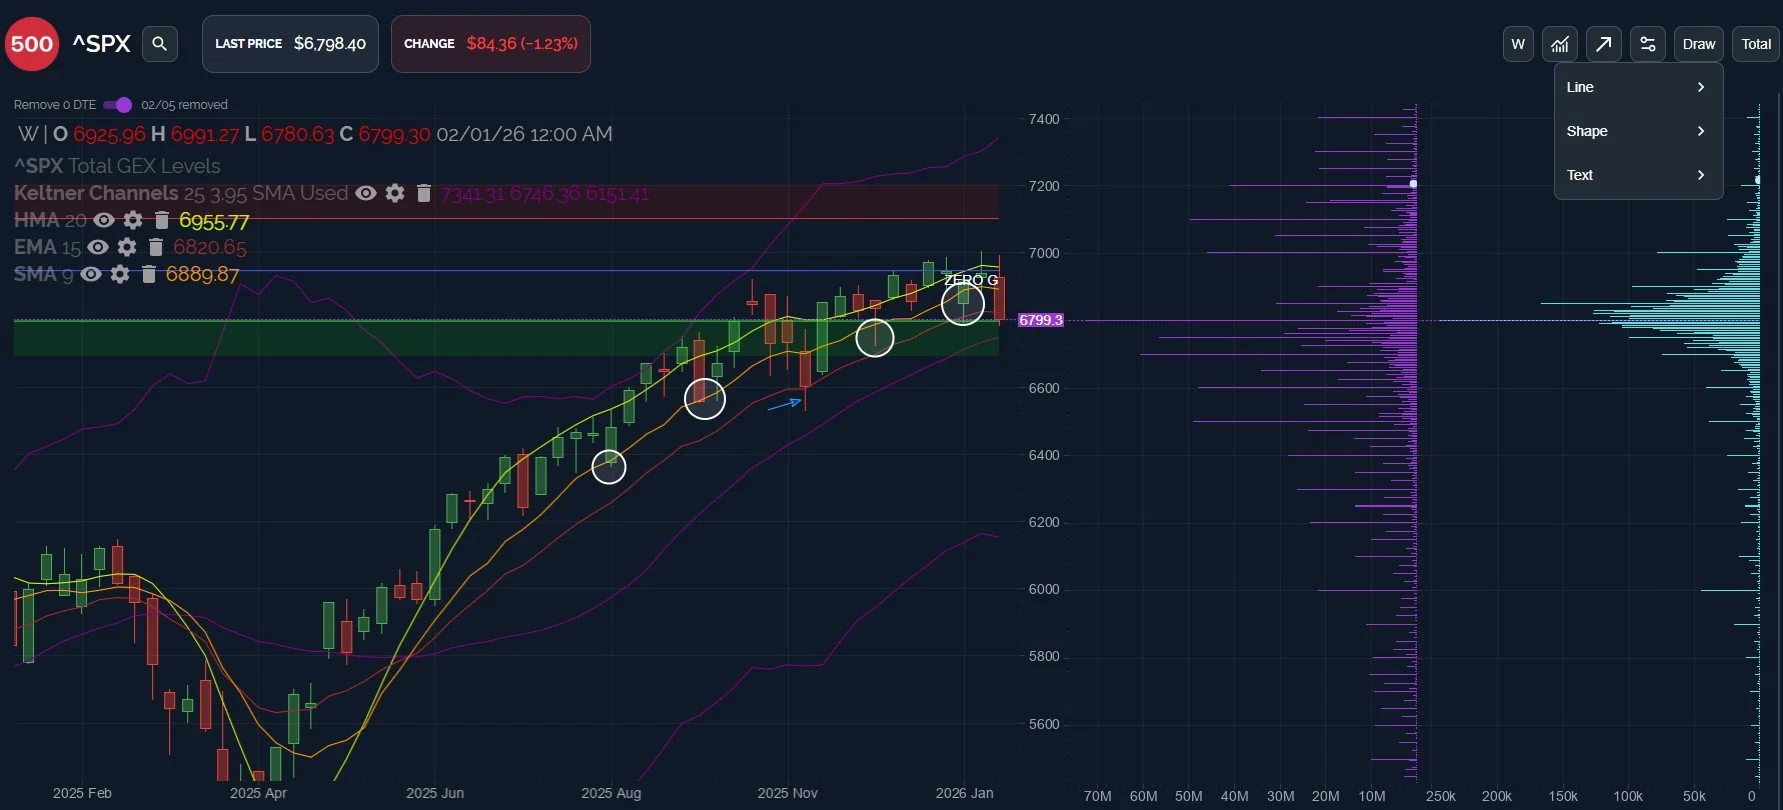
Let’s look at SPX’s weekly chart: We’re below all of my moving average indicators, and the middle Keltner channel at 6746 is the last line of support on the weekly chart before we need to flip back to the lower Keltner channel on the daily chart at 6619.
I circled the times we dropped below the 9 SMA, sometimes stopped declines, and other times we briefly touched or approached the 15 EMA before bouncing, recovering back to the HMA each time.
I drew a line highlighting the one week last November when we saw a wick below the 15 EMA. The following week gapped above the line and continued all the way through resistance, closing above the weekly HMA.
We’re currently below the 15 EMA, but that doesn’t guarantee a sharp rebound next week, even if we do see a rebound. We need to see where the market encounters resistance and what happens at that point.
The net GEX picture shown below brings attention to 6800, which we’ve mentioned earlier this week, and really we see almost equal net GEX clusters from 6500-6700. The current decline could culminate anywhere within this area, ideally.
In the event of an immediate bounce before continuing lower, the gross GEX picture (not shown here, but we can toggle that on our charts) shows 6900 to be very important, and that potential ceiling also coincides with the 9 SMA on the weekly. Those same MAs on the daily chart range from 6913-6937, so very close together. Breaking through and closing above 6900 raises the odds of exceeding 7000, but let’s take it one level at a time.
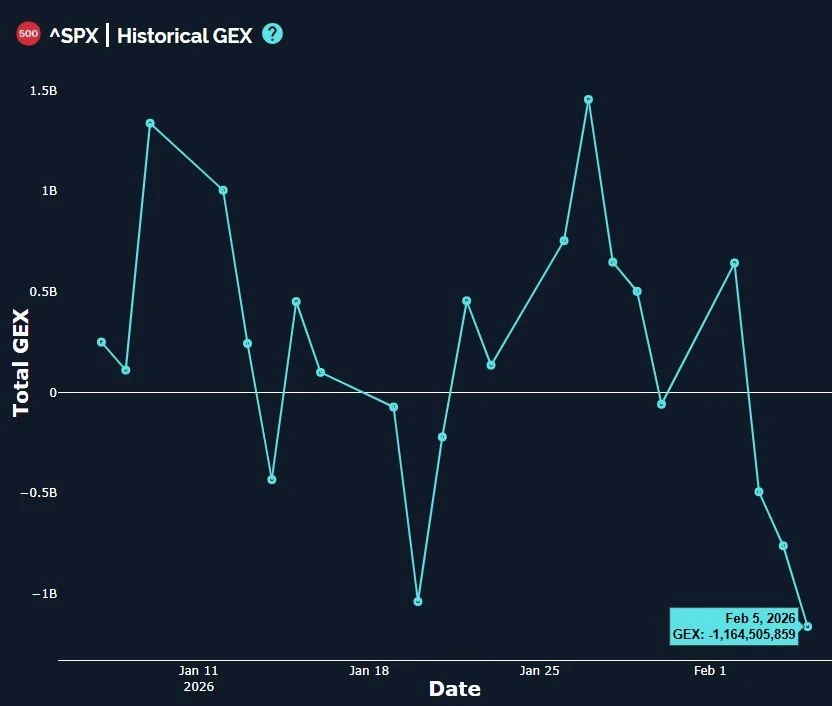
SPX net GEX yet again moved deeper into negative GEX territory, yet SPX is not yet at an extreme reading. That said, SPX has rebounded following such low readings several times over the past year.
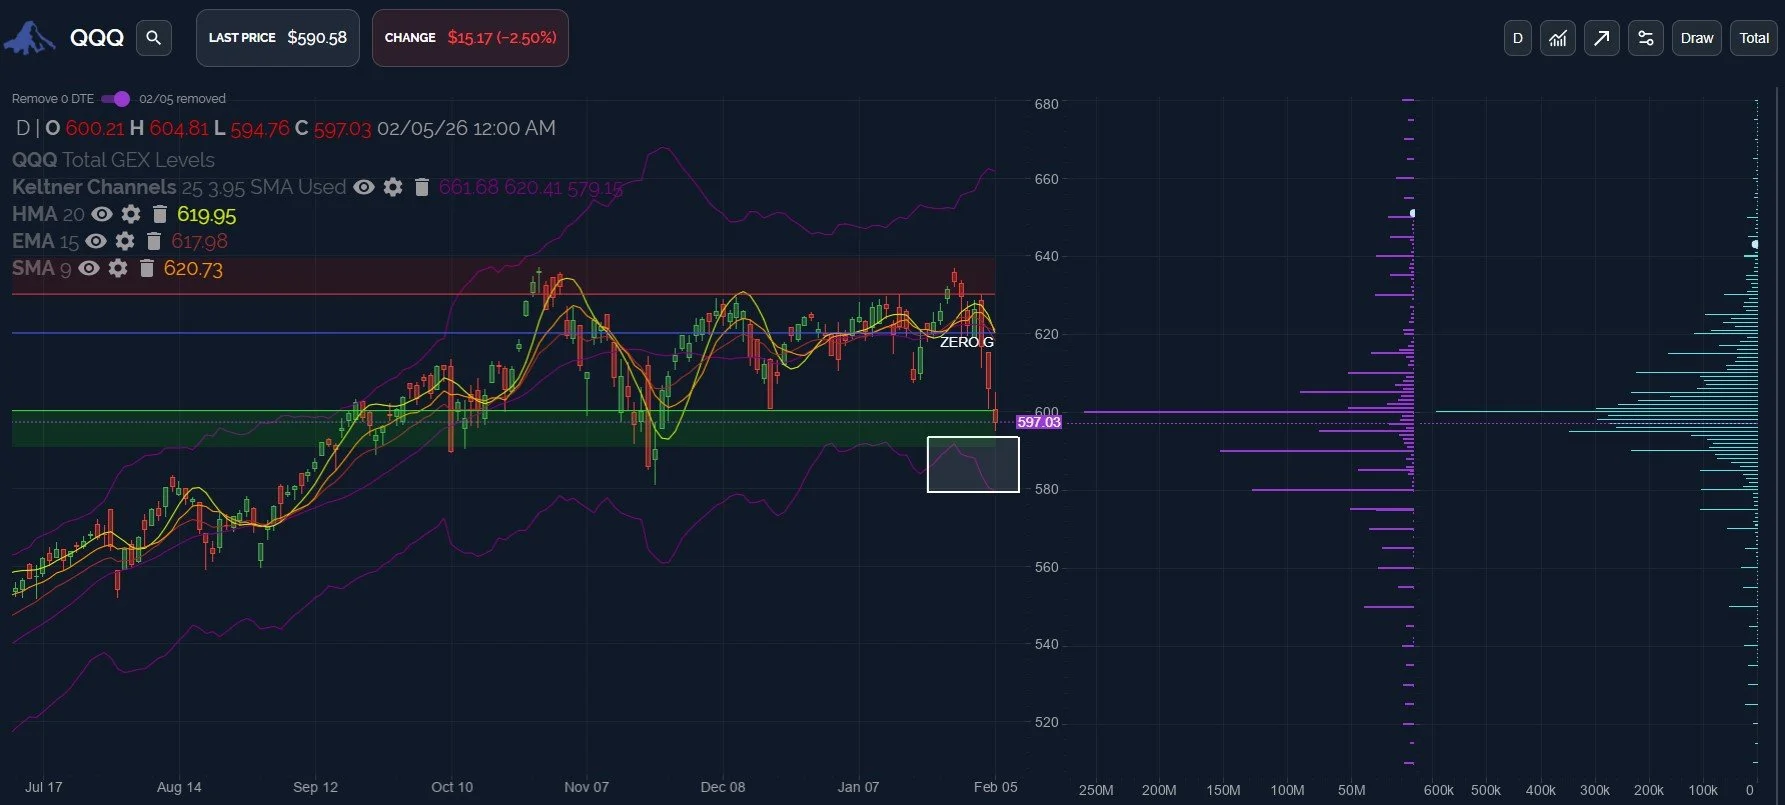
QQQ has been particularly weak, now approaching the November low.
QQQ is within the lower Dealer Cluster zone, where we expect dealers might become buyers, and negative GEX does diminish below 580.
AMZN is not looking too hot after hours, and QQQ traded down to 587 following the report, so QQQ is likely not too far away from a reversal area as well. The lower Keltner channel at 579 provides another indication that price is getting stretched to the downside.
QQQ is stretched farther below the HMA than at any time visible on the screenshot, implying a potential rebound towards 619.95, at which point we would want to reassess the situation.
While not a lot of net GEX is visible at 620, we still see a large gross GEX position at that spot (not visible on the absolute net chart below).
If QQQ bottoms near 580, the more bearish rebound may only take QQQ back to 600 before more downside, so be aware of that scenario as well. We’ll be monitoring changes in data as price makes its decision in coming days.
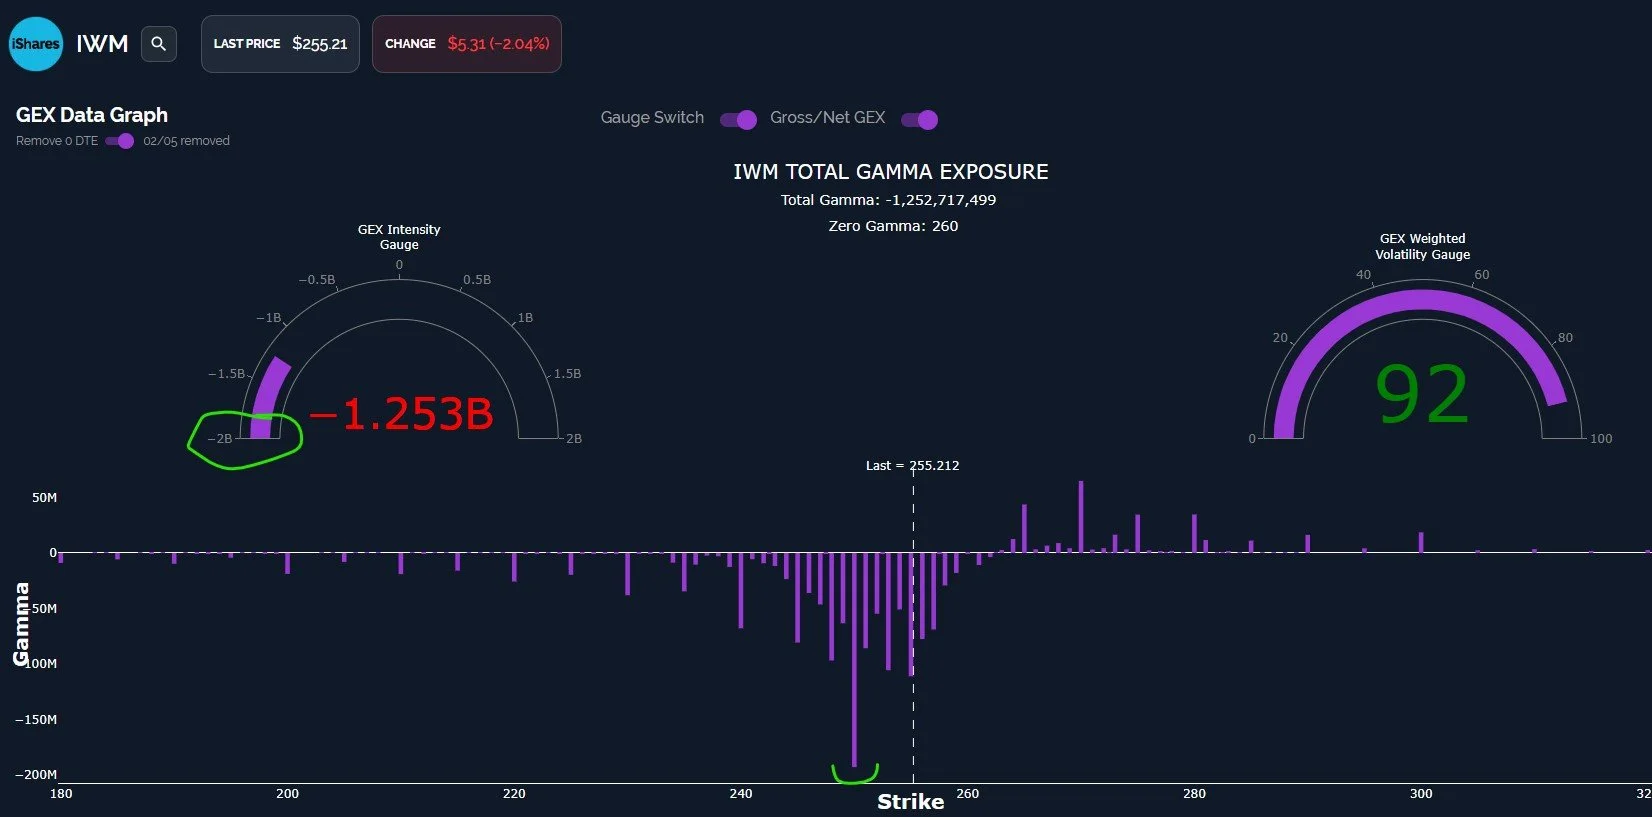
Lastly, a quick look at IWM, which did drop to the 255 GEX cluster today. 250 remains “the big one” that we’re currently watching as a potential buying opportunity.
The GEX Intensity Gauge shows that GEX is approaching levels we consider extreme when compared to readings over the past year, which has been a condition associated with IWM bounces, by my observation.
Negative GEX is associated with fast and wide swings in price, so keep that in mind as you consider sizing of trades, especially with the VIX elevated. We’re looking forward to identifying opportunities amidst the carnage in coming days.
We’ll take a look at the 0 DTE picture in the morning and share our observations in Discord, so we hope you’ll join us!
To enter Discord as a non-subscriber, go to our homepage and click on Community to enter our Discord server! First-time guests receive a free 7-day trial of the premium Discord channels and this is where we discuss what’s happening in real-time.
We also have a live stream accessible from our homepage every day around 10:30am ET, so feel free to join us there.
We are currently offering an annual discount for the Portfolio Manager subscription, so check out the first paragraph of this newsletter for more info!
Thanks for being part of our community and know that we invite and appreciate your feedback!
The information provided by Geeks of Finance LLC is for educational purposes only and is not intended to be, nor should be construed as, an offer, recommendation or solicitation to buy or sell any security or instrument or to participate in any transaction or activity. Please view our Investment Adviser Disclaimer and Risk Disclosure.