
VIX Expiration & OpEx Week: February 17 Stock Market Preview
Our $300 discount off of the annual Portfolio Manager subscription has a few more days, enter code WINTER2026 at checkout!
Markets are closed Presidents Day (so no livestream), but we will have a new YouTube video Monday evening, so check it out by clicking Community at the top of our homepage to find the link to our YouTube channel!
Indices attempted to rebound Friday, though the rebound was relatively weak, and a number of data points back a potential deeper dip before a larger bounce.
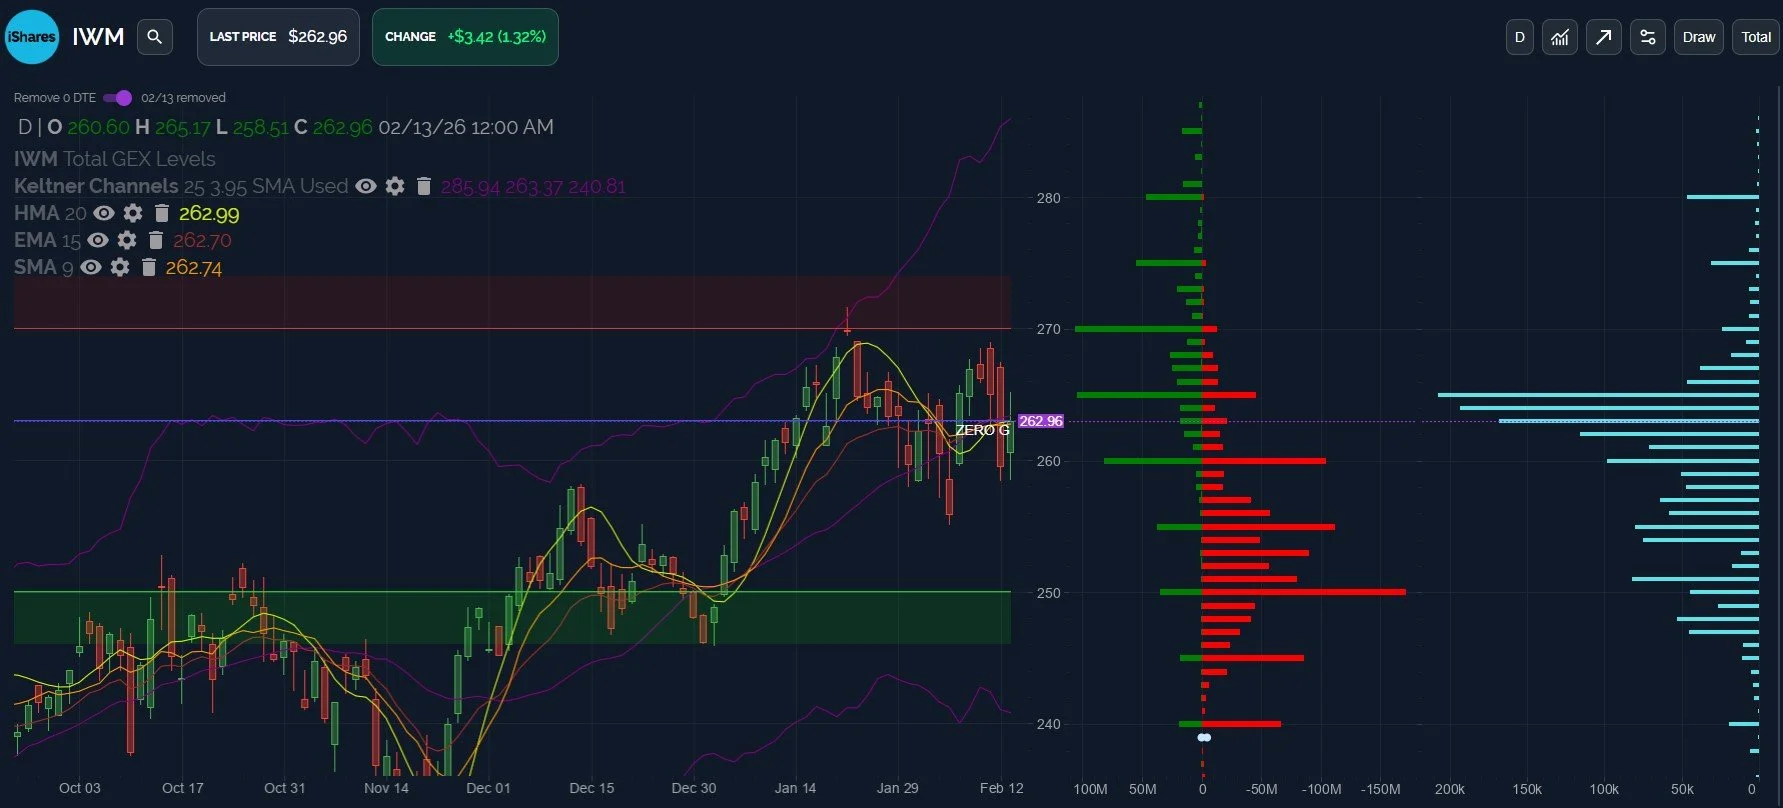
That said, IWM continues to look the most bullish amongst indices, in my opinion, with the Keltner channels suggesting more upside.
The counter points to the Keltner channels is that IWM closed just below the HMA and the negative GEX at 250 continues to be prominent.
It’s entirely possible that further downside in QQQ and SPX may drag IWM down to the lower Dealer Cluster zone at 250, though the flat bottom Keltner and lack of relative volume and GEX below 250 also imply a justifiable dip buy at that area, all things equal.
Likewise, a continued push higher into OpEx Friday may meet resistance at the 270 upper Dealer Cluster zone.
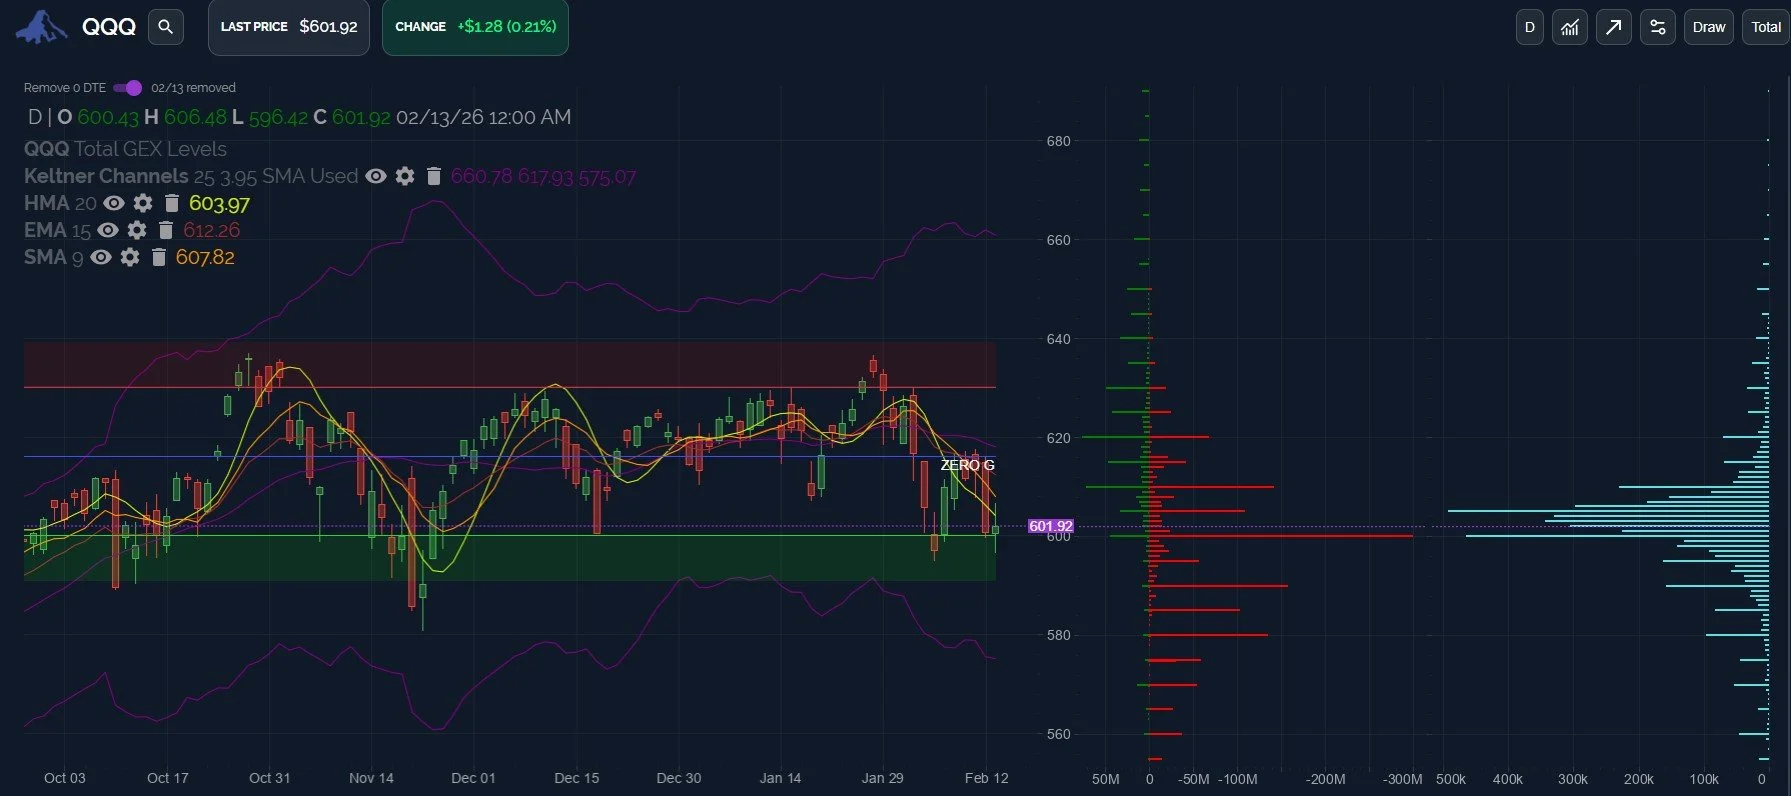
QQQ continues to look the weakest, with an apparent downtrend since late January, though I see the lower highs have not been met with lower lows. Could this imply a rally from this 600 zone?
The GEX cluster at 600 continues to be an important line-in-the-sand and support area going back to October, with very few days spent below that level. A break below 600 may lead to 580, which would retest the November lows.
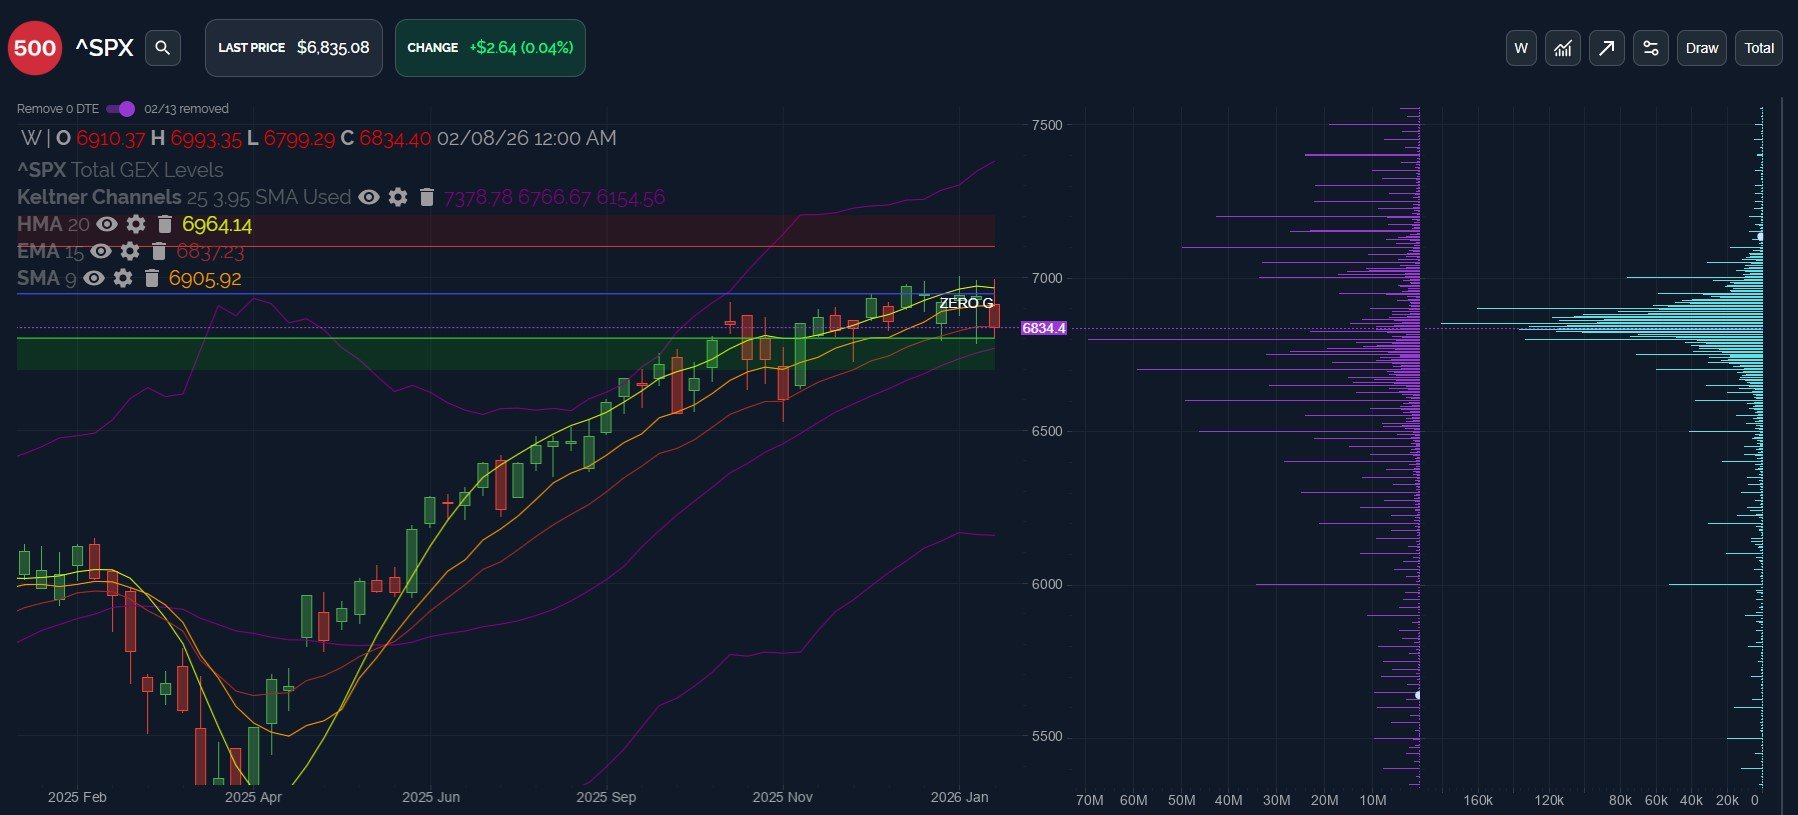
Previous charts have focused on perceived relevant levels on the daily charts, but SPX shows interesting levels on the weekly chart, so we’ll zoom out and take a look at SPX’s confluence with the weekly 15 EMA in particular.
SPX completed its first red weekly candle in 6 weeks, also 2 points below the weekly 15 EMA. I usually don’t draw attention to a difference of 2 points with my indicators, but it’s worth noting that SPX hasn’t closed even a point below the 15 EMA since the week ending April 13, 2025.
While the April close was the week after the 2025 low, this time around, we are two weeks beyond a new high.
The next area we’ll watch below is 6750-6766, then 6700. If SPX can retake 6900, 6964 (the HMA) is a target, with 7100 being the next big level above 7000.
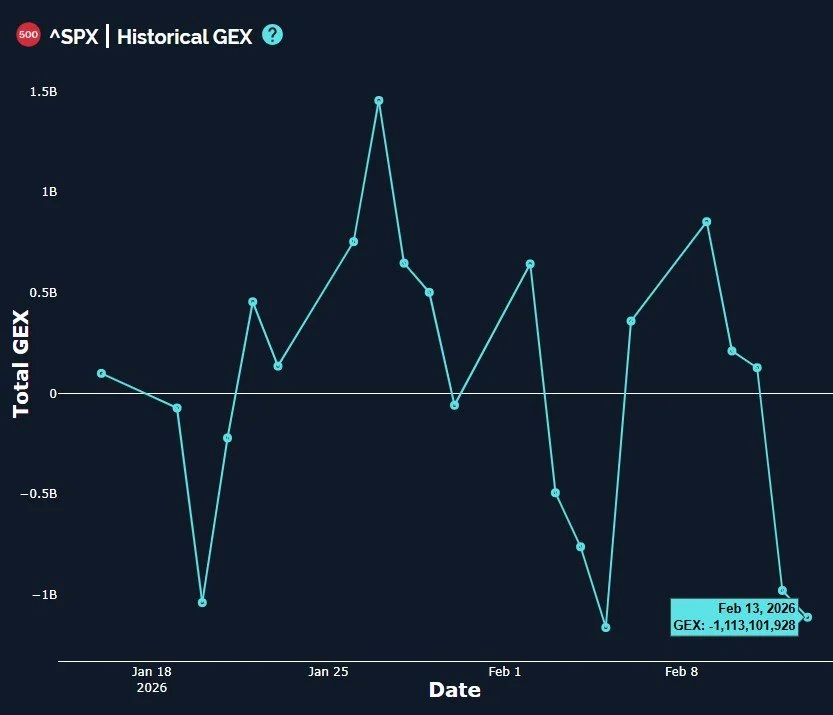
SPX dropping even deeper into negative GEX territory on a Friday is not encouraging, especially since SPX is not yet at a negative GEX extreme, which might end up being contrarian (when/if it happens).
Otherwise, the current reading just beyond the -1B mark appears negative.
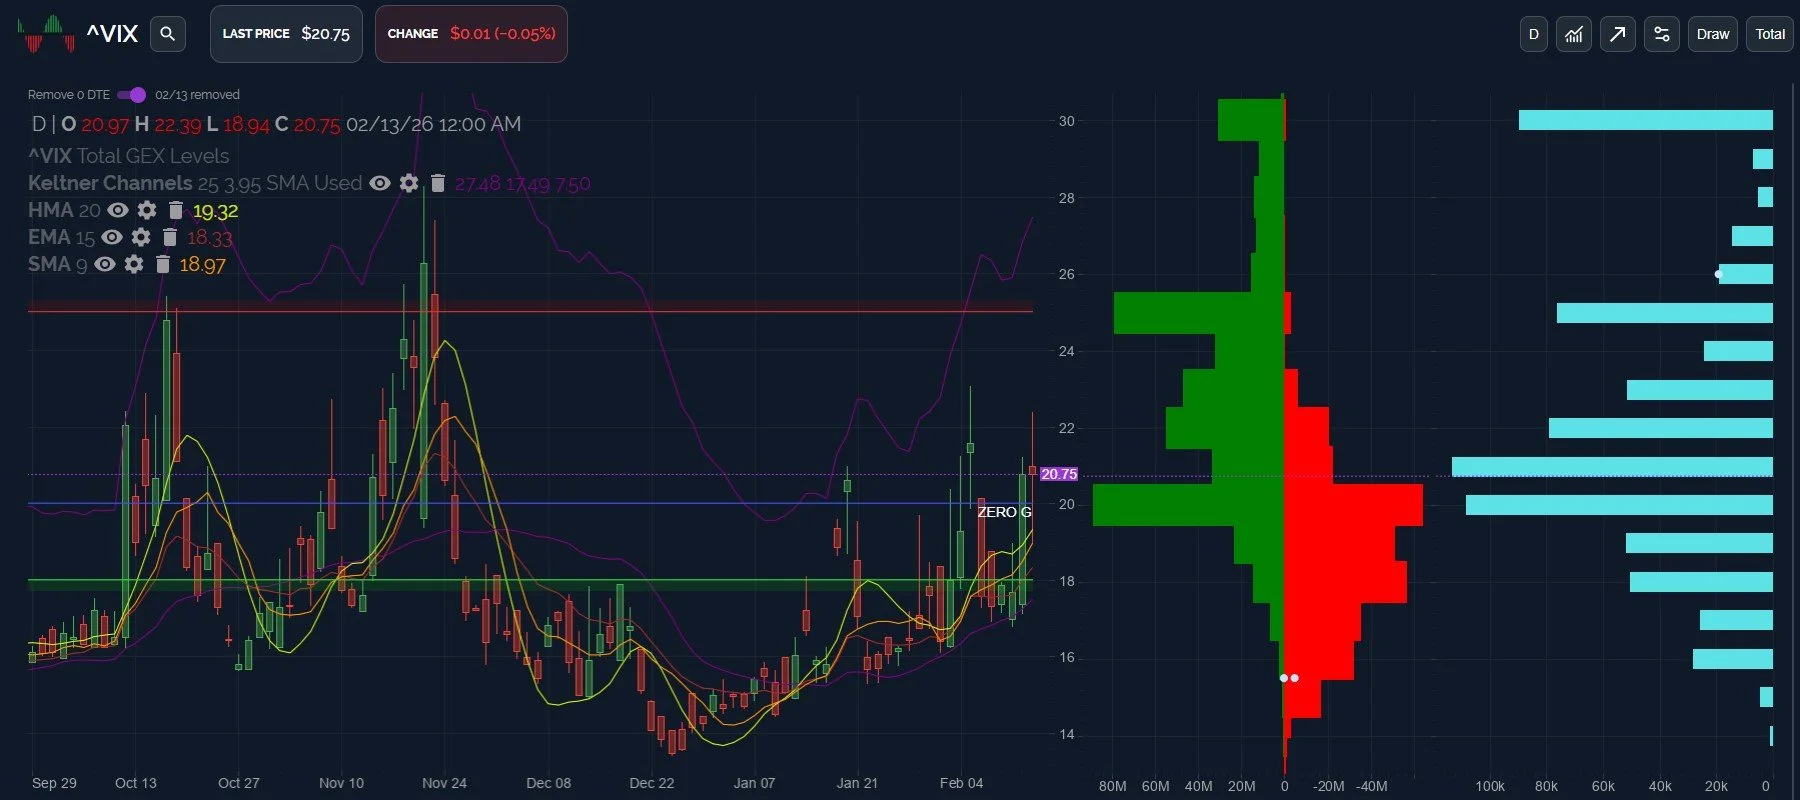
GEX has flipped positive on the VIX, with GEX at the 25 strike most strongly represented for Wednesday’s monthly option expiration, implying risk to the upside into Wednesday. The steady uptrend since December is uninterrupted, even with intraday volatility surrounding the high points, so we are cautious toward the idea that the VIX immediately deflates without a larger spike toward 25-30.
It’s OpEx week, so anything can happen, and we may end up seeing a whipsaw mid-week, depending upon what happens with the VIX into Wednesday. Let’s consider the 0 DTE picture Tuesday morning in hopes that we can build more confidence about the next move. Thanks for reading!
To enter Discord as a non-subscriber, go to our homepage and click on Community to enter our Discord server! First-time guests receive a free 7-day trial of the premium Discord channels and this is where we discuss what’s happening in real-time.
We also have a live stream accessible from our homepage every day around 10:30am ET, so feel free to join us there. You can also listen to our most recent livestream anytime before the next day’s livestream occurs.
We are currently offering an annual discount for the Portfolio Manager subscription, so check out the first paragraph of this newsletter for more info!
Thanks for being part of our community and know that we invite and appreciate your feedback!
The information provided by Geeks of Finance LLC is for educational purposes only and is not intended to be, nor should be construed as, an offer, recommendation or solicitation to buy or sell any security or instrument or to participate in any transaction or activity. Please view our Investment Adviser Disclaimer and Risk Disclosure.