
RIght On Track…
We were happy to see our primary scenario unfold today. How many times do we see after hours dread at dusk turn into delightfulness at dawn? Seems like it’s fairly often, in this Fed-fueled bull. NVDA reversed early losses and opened at our $150 target. Markets climbed to reach the Hull Moving Average as we suggested was a fairly decent likelihood in yesterday’s newsletter. 6000 remains as a substantial gamma (GEX) cluster for Friday. In today’s YouTube video, we take a look at SPY and SPX, PLTR, and GOOG and we dedicate the first part of the video to various scenarios that might unfold, so give it a brief viewing.

Looking at the chart above, we see that SPX reversed a gap down and rallied to retest the Hull Moving Average from below. It’s quite natural to see the market close just below resistance. Why make it easy for the bulls by closing above resistance and having them sleep well at night? Nope, dealers need retail to bite their nails as Melvin, unemployed 24-year old who got rich buying Bitemecoin, wonders whether or not he made a mistake not closing out his positions before heading home. I mean, before he gets dressed for the day and emerges from his basement trading station. Don’t sweat it, Melvin, you can change the narrative 12 times but you still have some hard facts supporting your longs.
Opening above (or rallying above during the cash session) the Hull puts 6023 squarely in our sights, and, as we see on the chart below, SPX GEX has continued to move in a positive direction, reaching a fairly bullish 971M.

SPX Historical GEX: www.geekoffinance.com
SPX and SPY both show significant GEX levels above 6000 all the way to 6200, though the dates are farther away. We are in a G1 Dealer Cluster Zone, which means even with those higher strikes, we still may see rejection from this area. If we glance back up at the Tradingview chart of SPX, we see the upper Keltner channel at 6023 matches fairly closely to SPX 6000, and in my experience, (and statistically), trips above the upper Keltner channel are not commonly maintained as permanent plateaus. We typically see price consolidation or the Keltners moving higher to reflect a steep ascending channel, so keep that in mind. The unknown is whether the weekly chart or daily chart is “in charge” at any moment, so we have to look at various possibilities. But for now, GEX at 6000 and the top Keltner resistance at 6023 on the daily chart seem to indicate a reasonable range to watch for a potential top, if we end up taking what we think is the higher probability pathway upward for now.

SPX GEX Levels: www.geeksoffinance.com
Looking at the 3D graph below, we still see 6000 as the largest GEX level for tomorrow’s expiry, so 6000 is very relevant as a level for this Friday. We see higher targets like 6055 and 6100, but those are late December into mid-January, so there’s plenty of time in between for some sort of potential pullback.
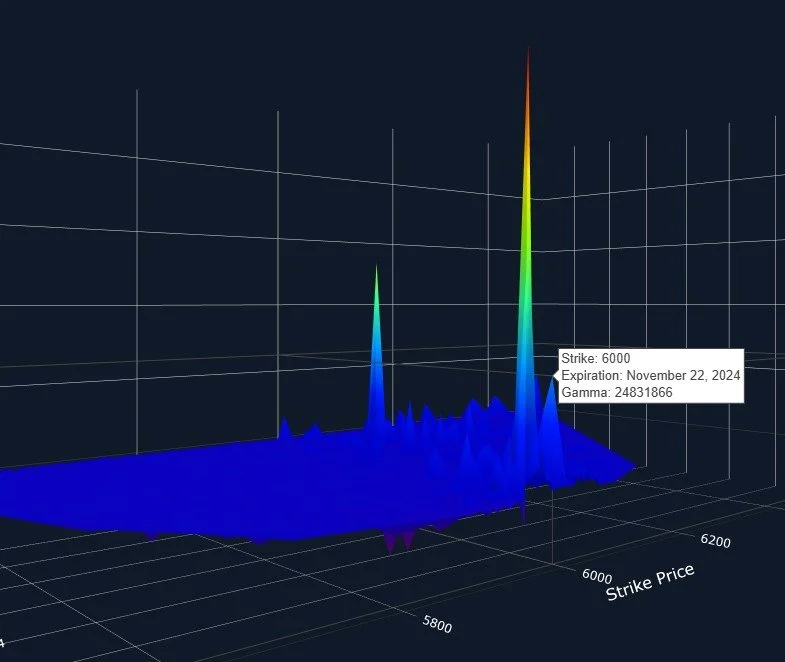
SPX 3D GEX Graph: www.geeksoffinance.com
One reason I mention a possible market pullback following the tag around the 6000 area (other than GEX and some chart indicators) is the VIX. The Hull has turned up for the VIX, and I lean long for any intrument above the Hull, short below. Now we did see a daily candle today that rejected the middle Keltner with a lower high and a lower low, so there’s at least the chance that the VIX may also be advertising a rally for SPX first, in which case we may see the VIX drop to 14.50-15 again while SPX aims for 6000. We still have an unfilled gap on the VIX just like we have unfilled gaps on SPY and QQQ…Can we call it “Kumbaya” if they’re all filling their gaps at the same time? Alright, so they’re going in opposite directions..We can call that “balance.”

The VIX also showed relatively large volume at higher strikes, and look at that positive GEX at 20, which is part of the reshaped GEX picture following Wednesday’s VIX expiration.

VIX GEX Levels: www.geeksoffinance.com
In summary, the overall positioning for SPX and SPY (as indicated by GEX) is solidly bullish looking out for some time. We didn’t even get into the stats behind year-end results when we are already up this much year-to-date. But we are very close to potential resistance and the VIX looks a little more constructive for volatility than a VIX-crushing bull might want to see, so perhaps we will see a two steps forward, one-step backward sort of pullback before a year-end rally. But tomorrow’s Friday, and 6000 is calling..Let’s see if Melvin answers. Join the conversation in Discord tomorrow and we’ll report what we’re seeing as the data unfolds!
If you’re interested in accessing our tools and analytics or taking advantage of our promotion (see the top of this newsletter), be sure to check out our website.
If you’re interested in learning more about our strategy and approach, we address all of these topics in our Geek University course which is included in all memberships.
Thanks for being part of our community and know that we invite your feedback!
We recently posted a YouTube video and we have many short videos for you to review where we cover a variety of predictions and educational topics.
The information provided by Geeks of Finance LLC is for educational purposes only and is not intended to be, nor should be construed as, an offer, recommendation or solicitation to buy or sell any security or instrument or to participate in any transaction or activity. Please view our Investment Adviser Disclaimer and Risk Disclosure.